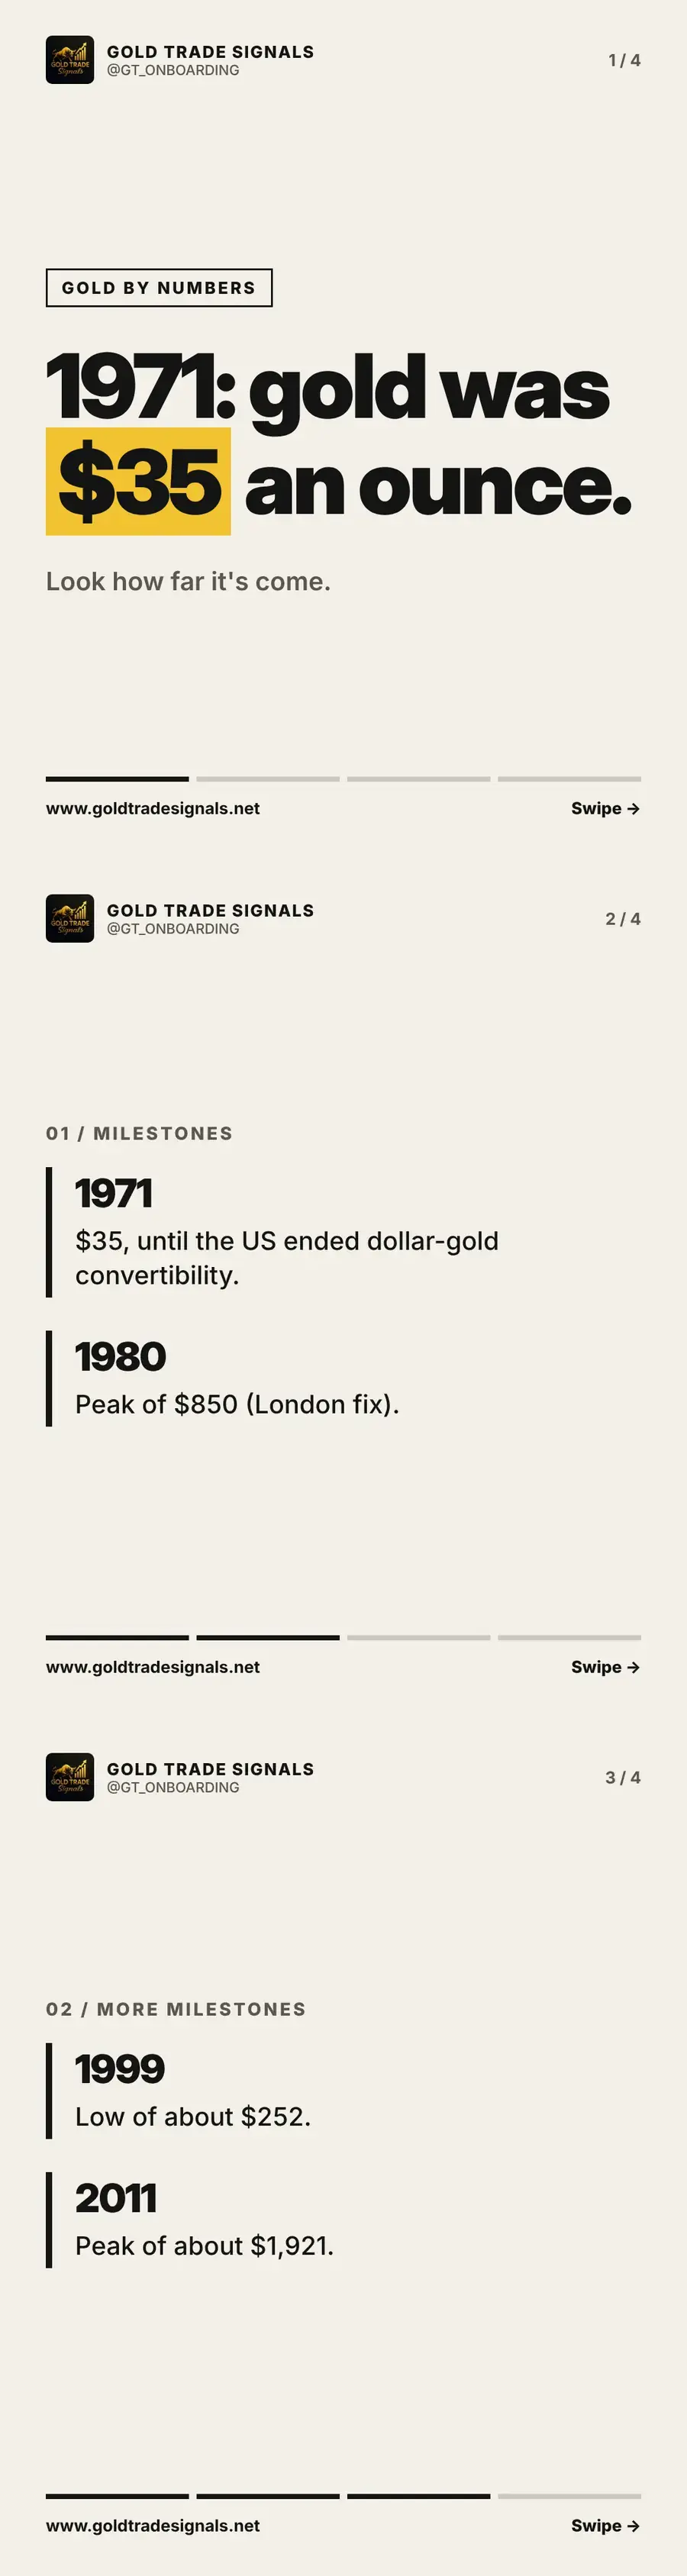
In 1971, gold was officially priced at $35 an ounce. Look how far it has come. This article walks through four milestones in gold's price history, from the end of dollar-gold convertibility to the peaks and lows that followed, and what each one tells a trader about how gold behaves.
1971 and 1980: the price breaks free
Until 1971, gold was fixed at $35 an ounce. That changed when the United States ended the convertibility of dollars into gold, and the price was left to find its own level. Freed from the fixed rate, gold climbed through the 1970s and reached a peak of $850 at the London fix in 1980.
1999 and 2011: low and new high
After the 1980 peak, gold spent many years drifting lower, bottoming at a low of about $252 in 1999. From there a long rise began, and in 2011 gold reached a new peak of about $1,921 an ounce. Between those two dates the price rose more than sevenfold, a reminder of how far gold can travel over time.
What the milestones tell a trader
Gold does not move in a straight line. It can rise for a decade, then fall for the better part of two, then rise again. Big moves tend to follow big changes in the wider world, such as the end of a fixed exchange system. The lesson for a trader is to respect how far price can travel, which is why every idea we send includes a stop-loss. Figures come from the World Gold Council and other named sources, correct at time of writing.
Key takeaways
- Gold was fixed at $35 an ounce until 1971
- The 1980 London fix peak was $850; the 1999 low was about $252
- Gold reached a peak of about $1,921 in 2011
Common questions
Why was gold $35 an ounce in 1971?
Under the system in place at the time, the US dollar was convertible into gold at a fixed rate of $35 an ounce. That ended in 1971 and the price began to float.
What was the lowest gold price in recent decades?
Gold fell to a low of about $252 an ounce in 1999 before beginning a long rise to its 2011 peak of about $1,921.
Trade ideas with the levels already worked out
Join the free community and receive XAU/USD trade ideas with entry, stop-loss and take-profit, live training on Tuesdays and Thursdays, and support whenever you are stuck.
Join free on TelegramOpen the calculatorsRisk warning: This article is educational content, not personal investment advice. Gold is a leveraged, volatile instrument and you can lose some or all of your capital. Gold Trade Signals is not FCA regulated. Read the full risk warning.
More from Gold by Numbers
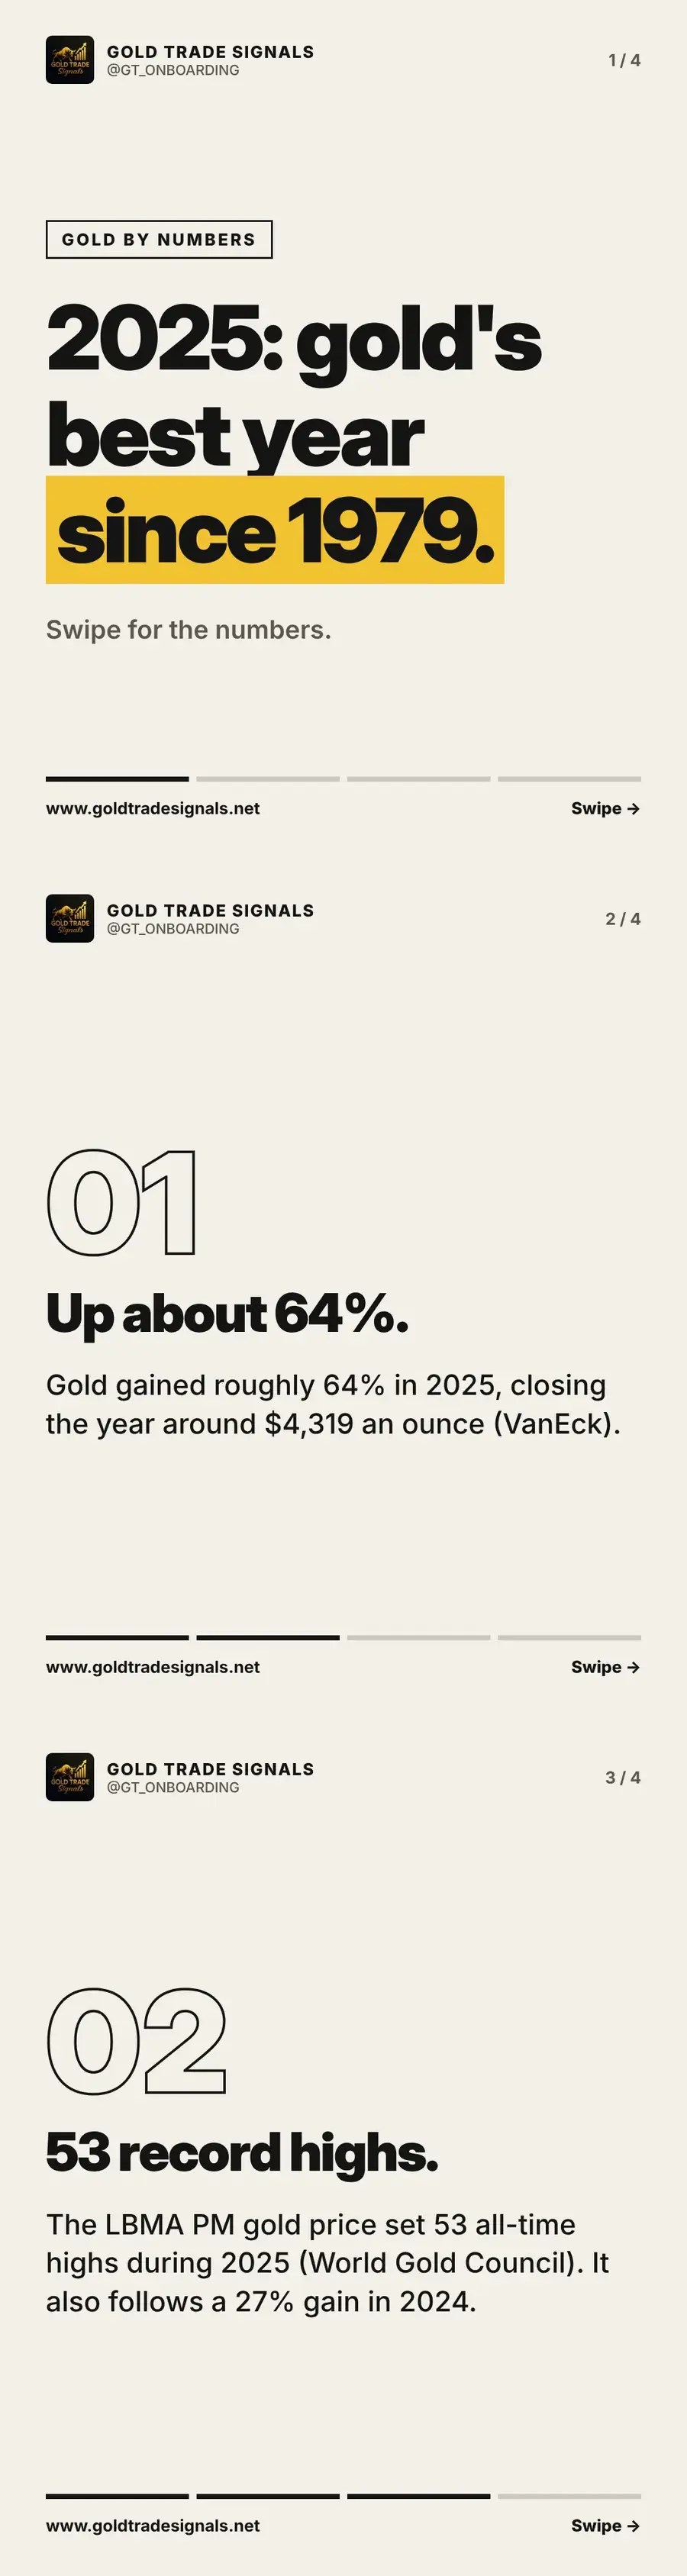
Gold in 2025: best year since 1979 with 53 record highs
Gold gained roughly 64% in 2025, closing around $4,319 an ounce, and set 53 all-time highs along the way. The numbers behind gold's best year since 1979.
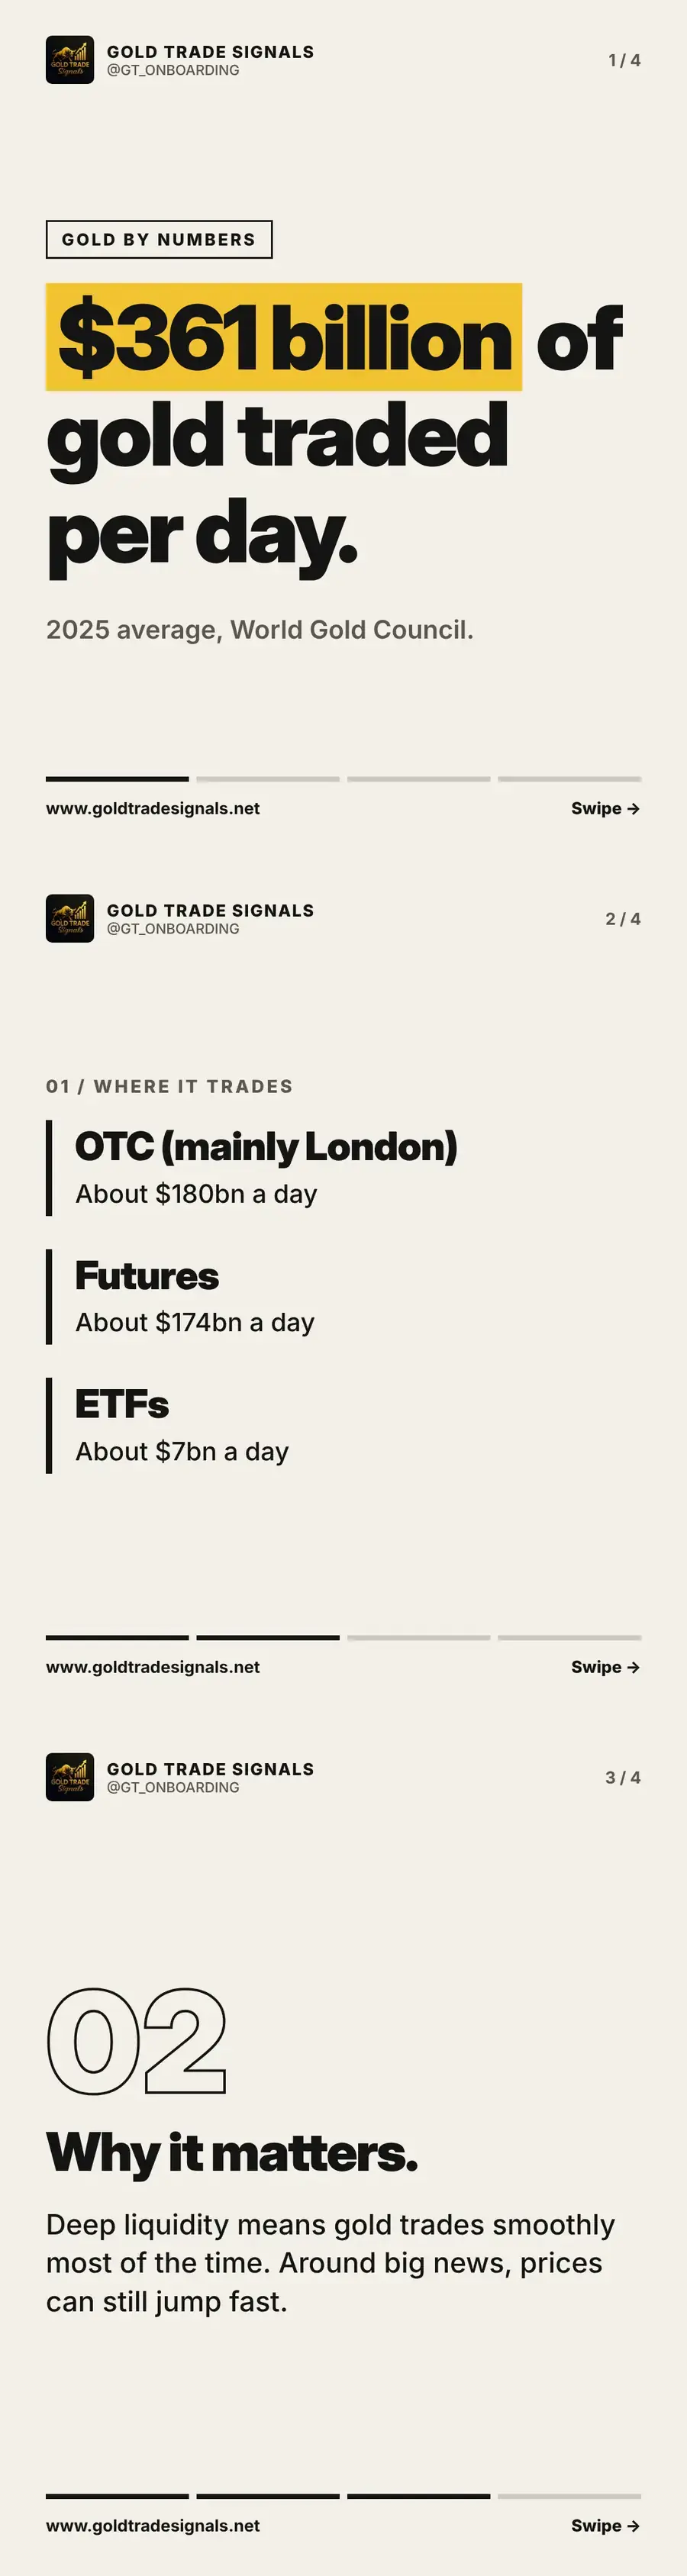
How much gold trades every day: around $361 billion
Around $361 billion of gold changes hands every day, split across OTC trading in London, futures and ETFs. Where it trades and why liquidity matters.
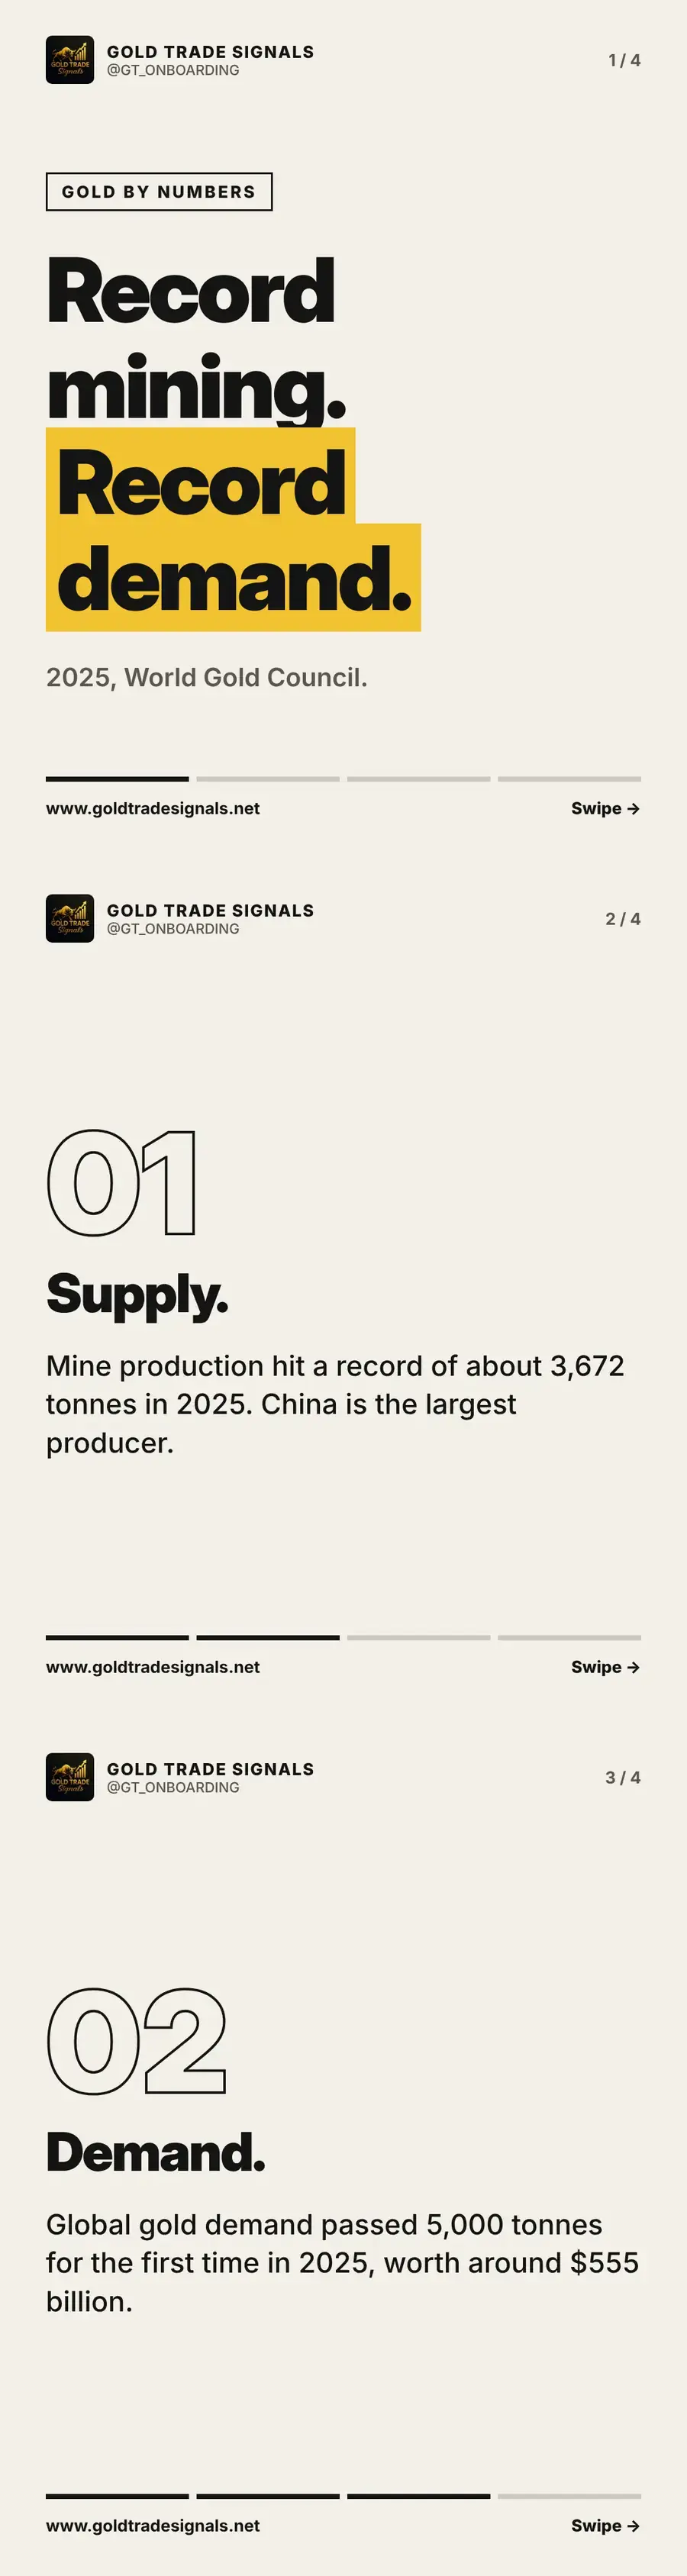
Record gold mining in 2025: 3,672 tonnes mined, demand past 5,000
Mine production hit a record of about 3,672 tonnes in 2025, and global demand passed 5,000 tonnes for the first time. What supply and demand numbers show.