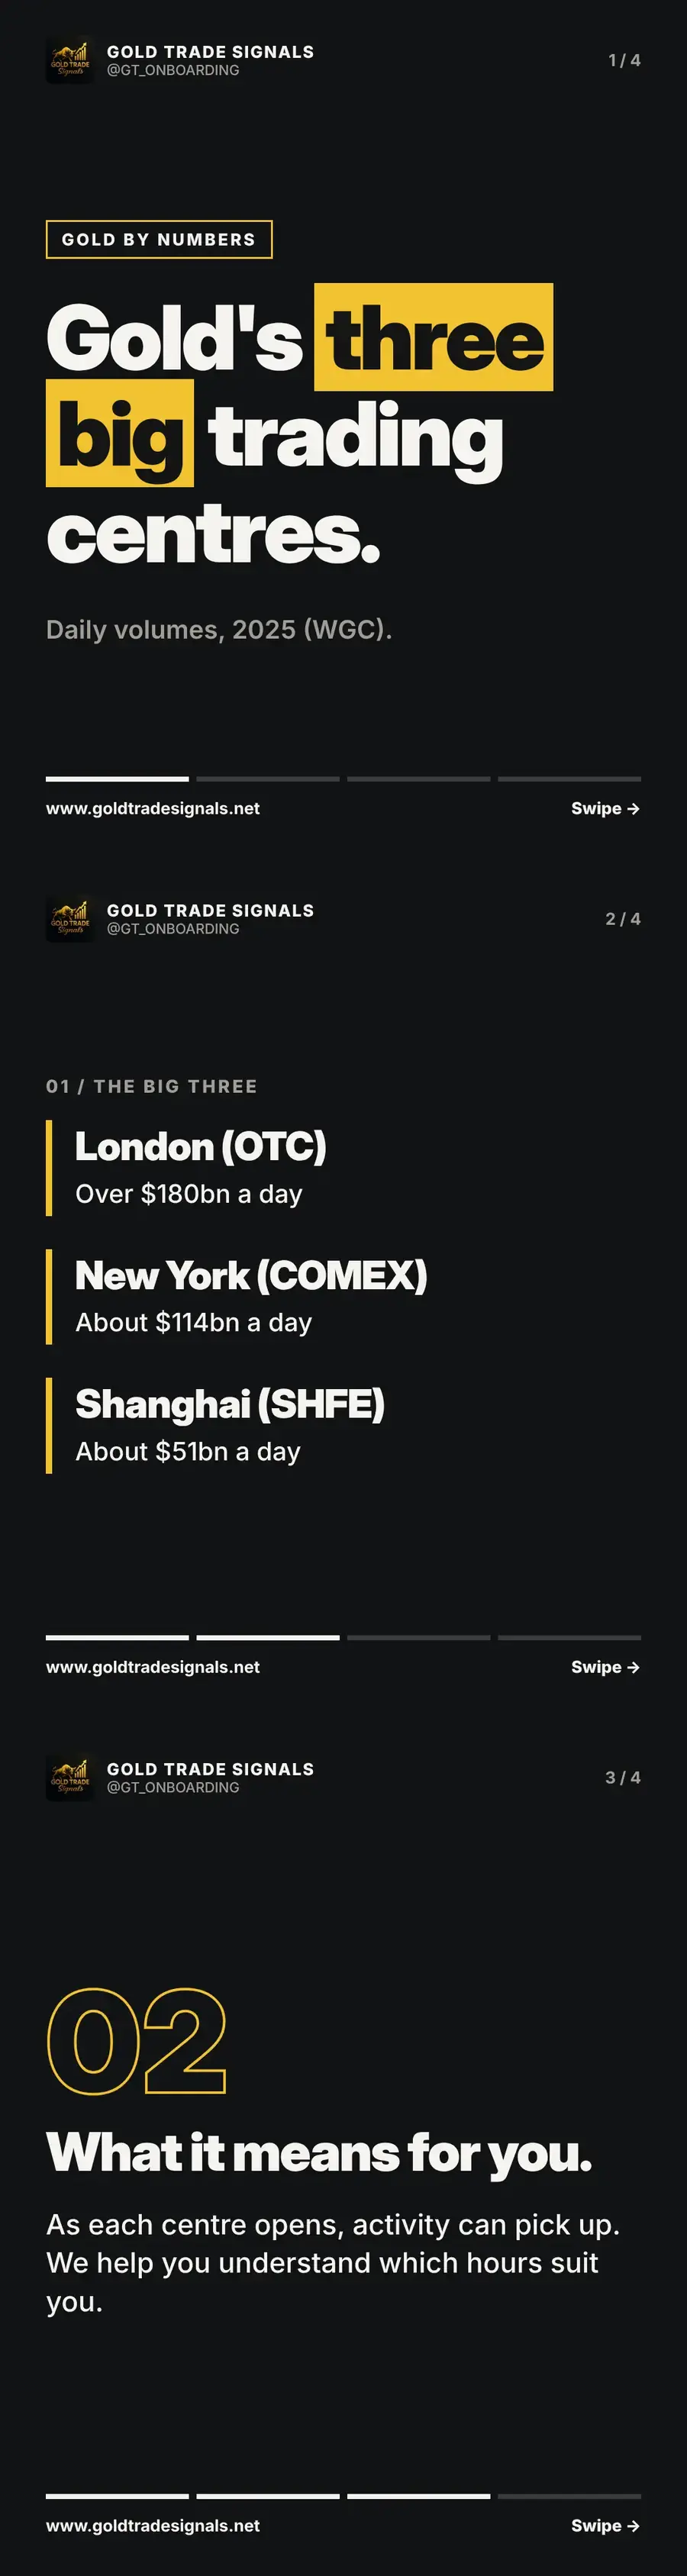
Where gold trades: London, New York and Shanghai
London trades over $180bn of gold a day, New York about $114bn and Shanghai about $51bn (2025, WGC). What the big three mean for your trading hours.
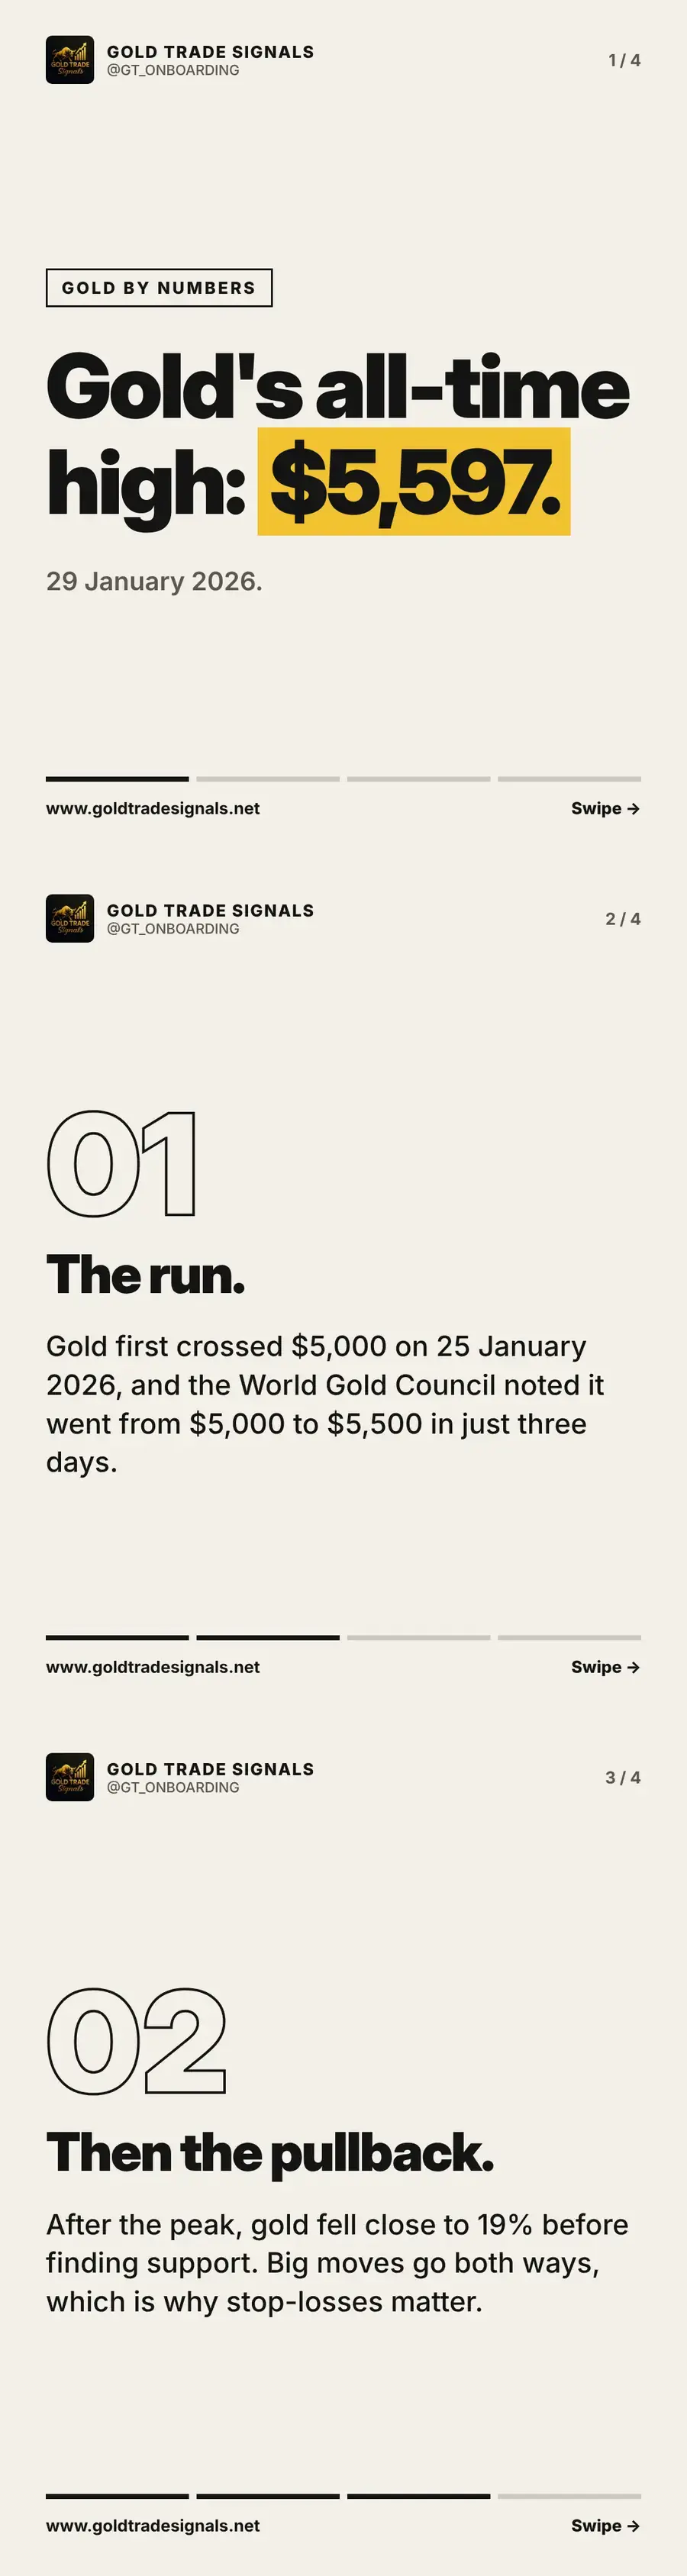
Gold's all-time high: about $5,597 an ounce on 29 January 2026
Gold hit a record of about $5,597 an ounce on 29 January 2026, days after first crossing $5,000. We look at the run, the pullback and the lesson for you.
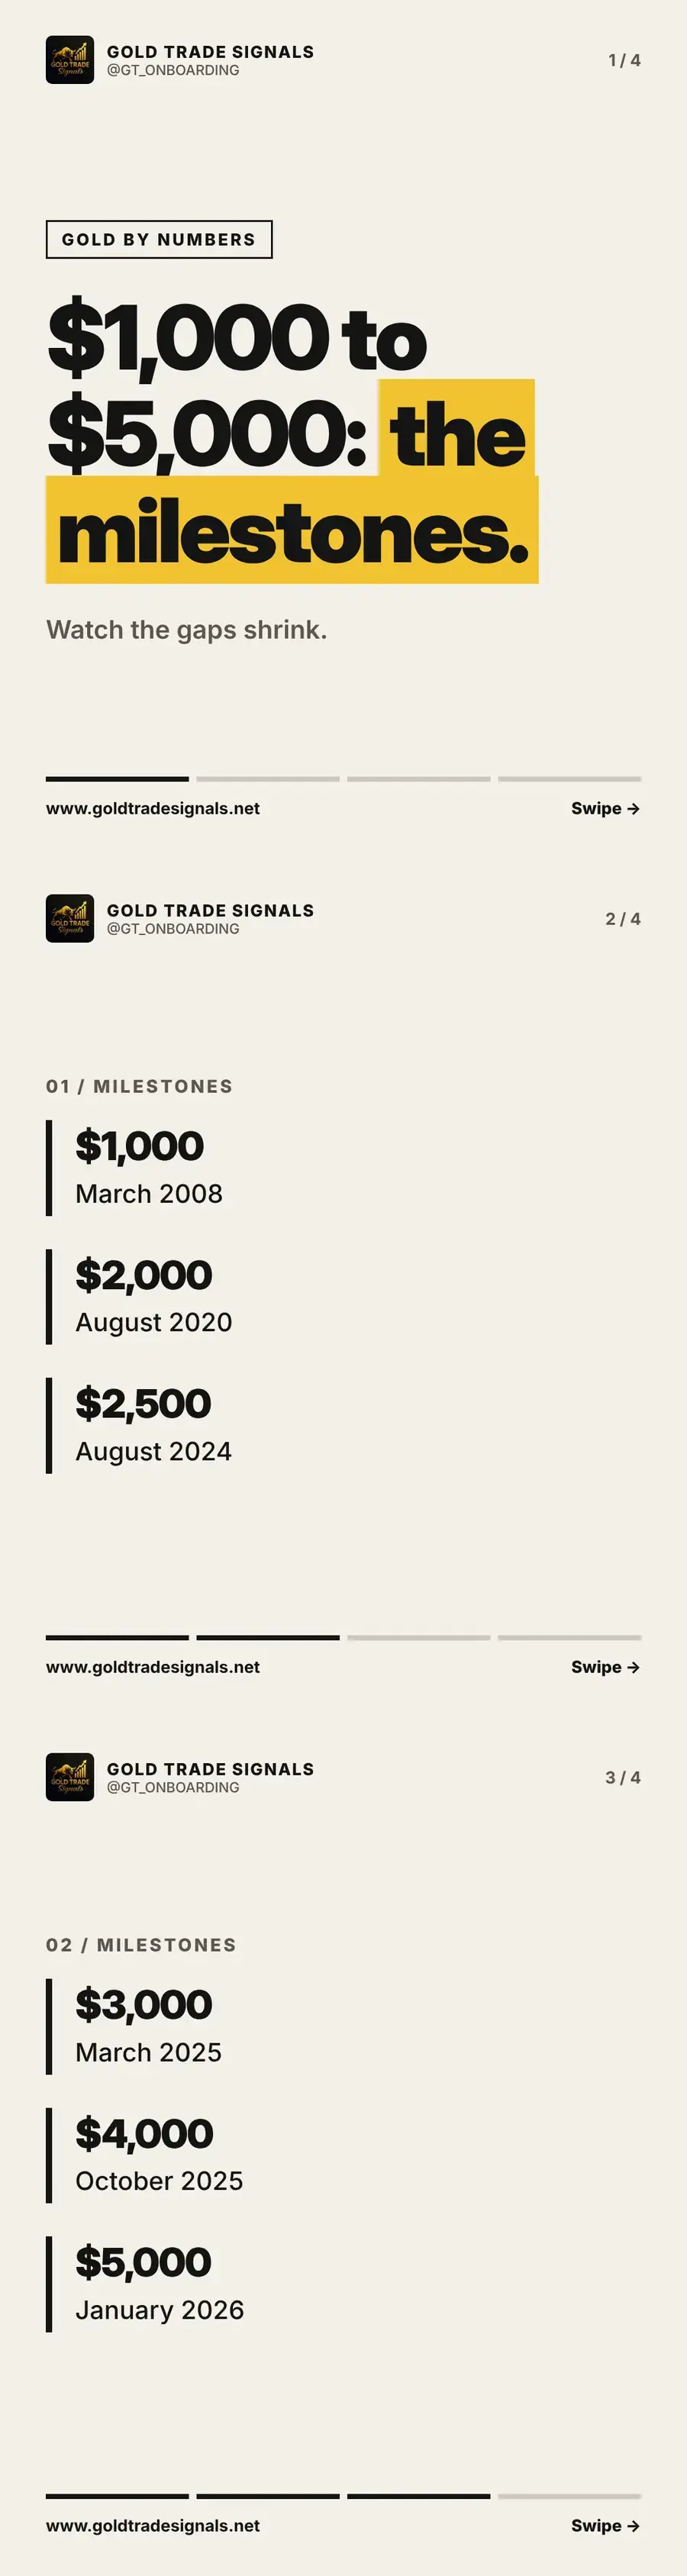
Gold price milestones: when gold crossed $1,000 to $5,000
From $1,000 in March 2008 to $5,000 in January 2026: the dates gold crossed each round-number milestone, and why the gaps between them kept shrinking.
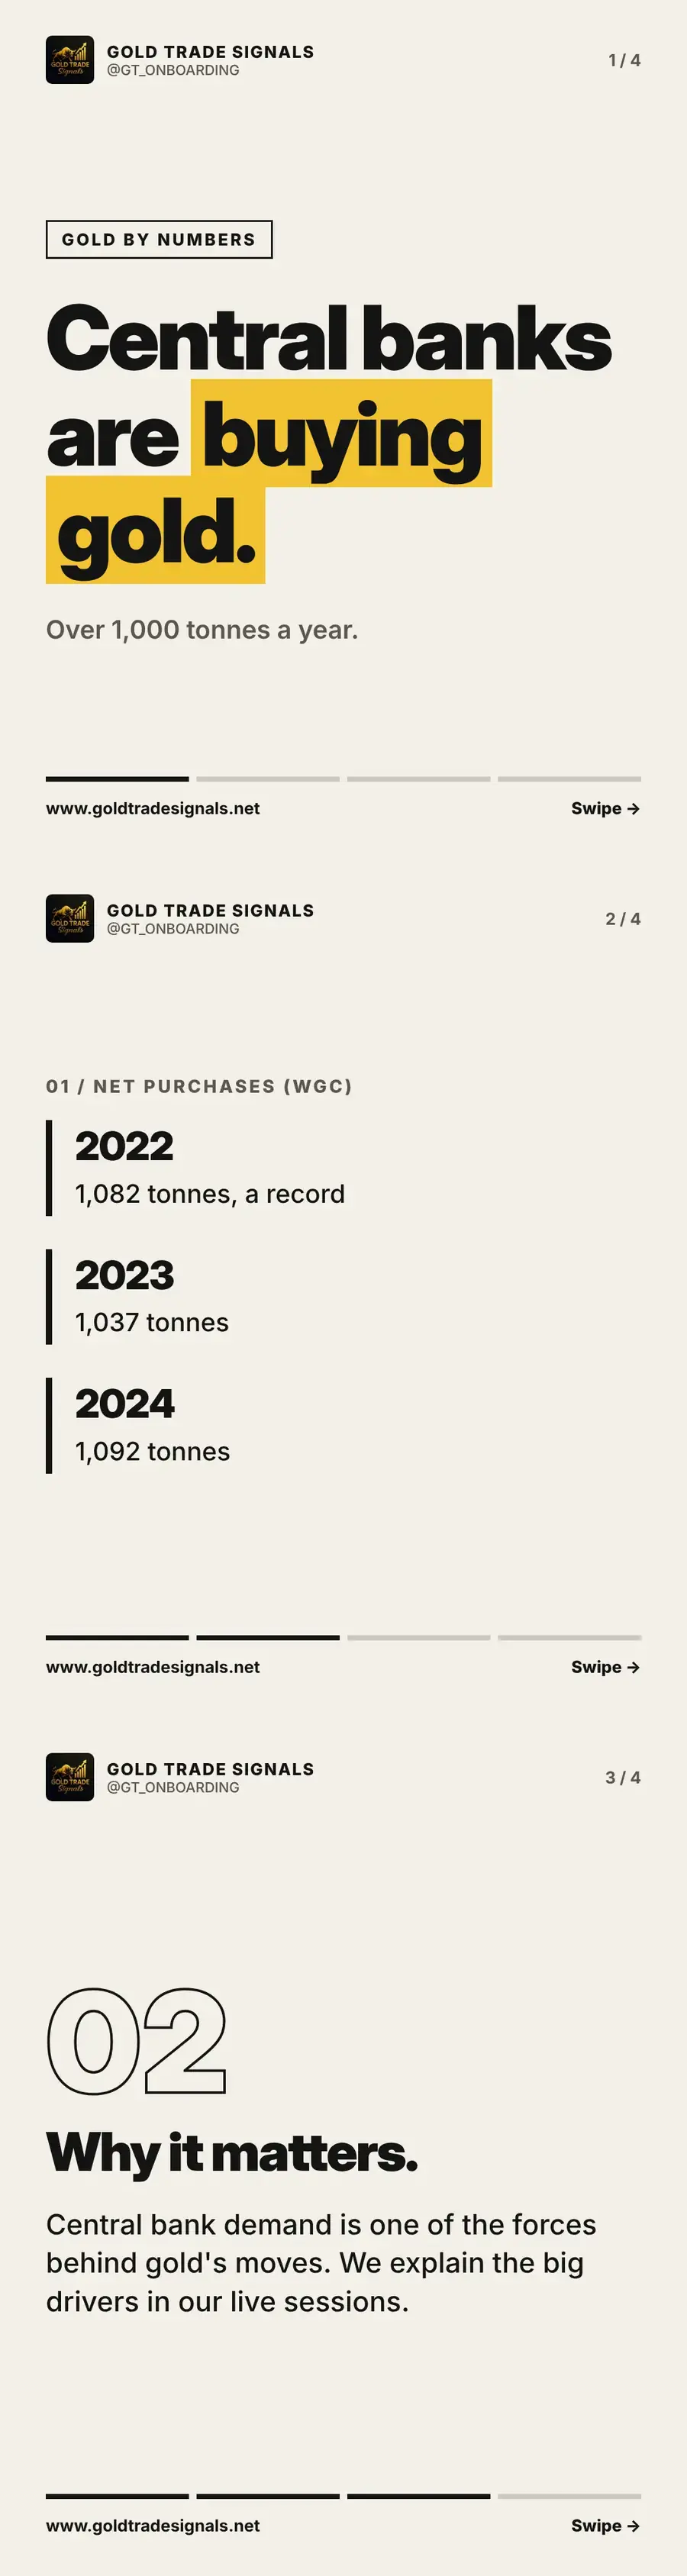
Central banks are buying gold: over 1,000 tonnes a year
Central banks bought over 1,000 tonnes of gold a year in 2022, 2023 and 2024, says the World Gold Council. We explain the figures and why they matter.
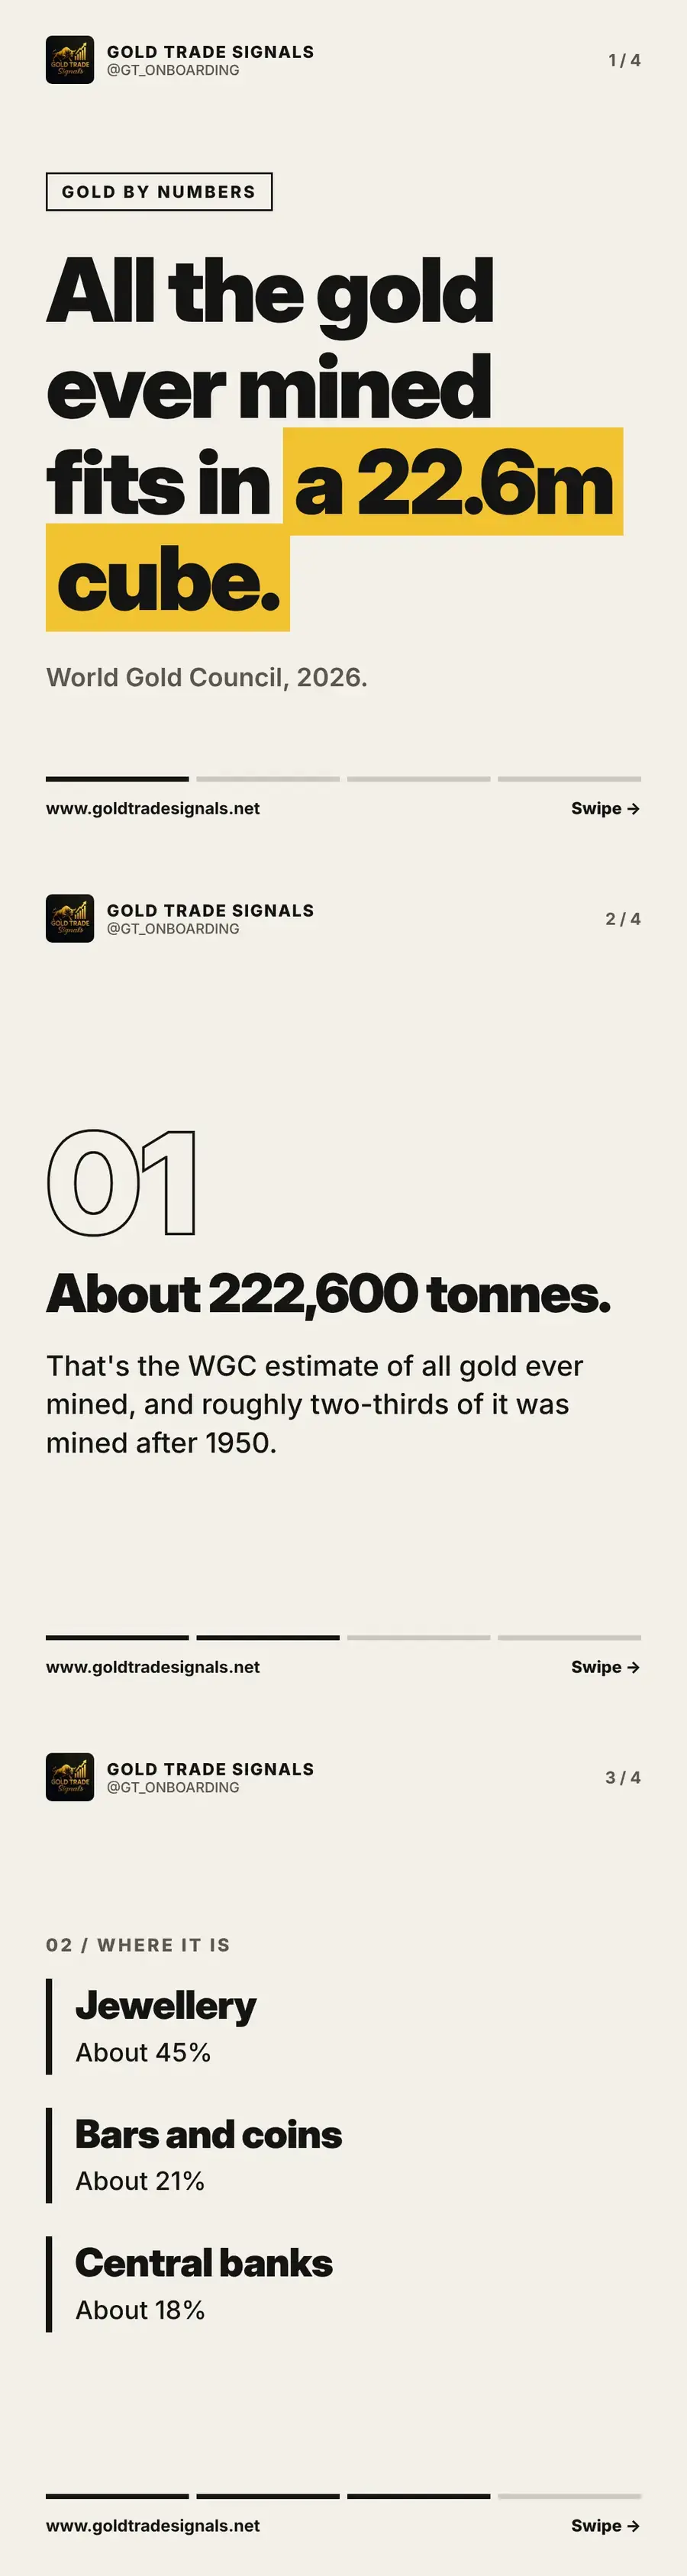
How much gold has ever been mined? About 222,600 tonnes
All the gold ever mined is about 222,600 tonnes, a cube about 22.6 metres wide. We break down where it is: jewellery, bars and coins, and central banks.
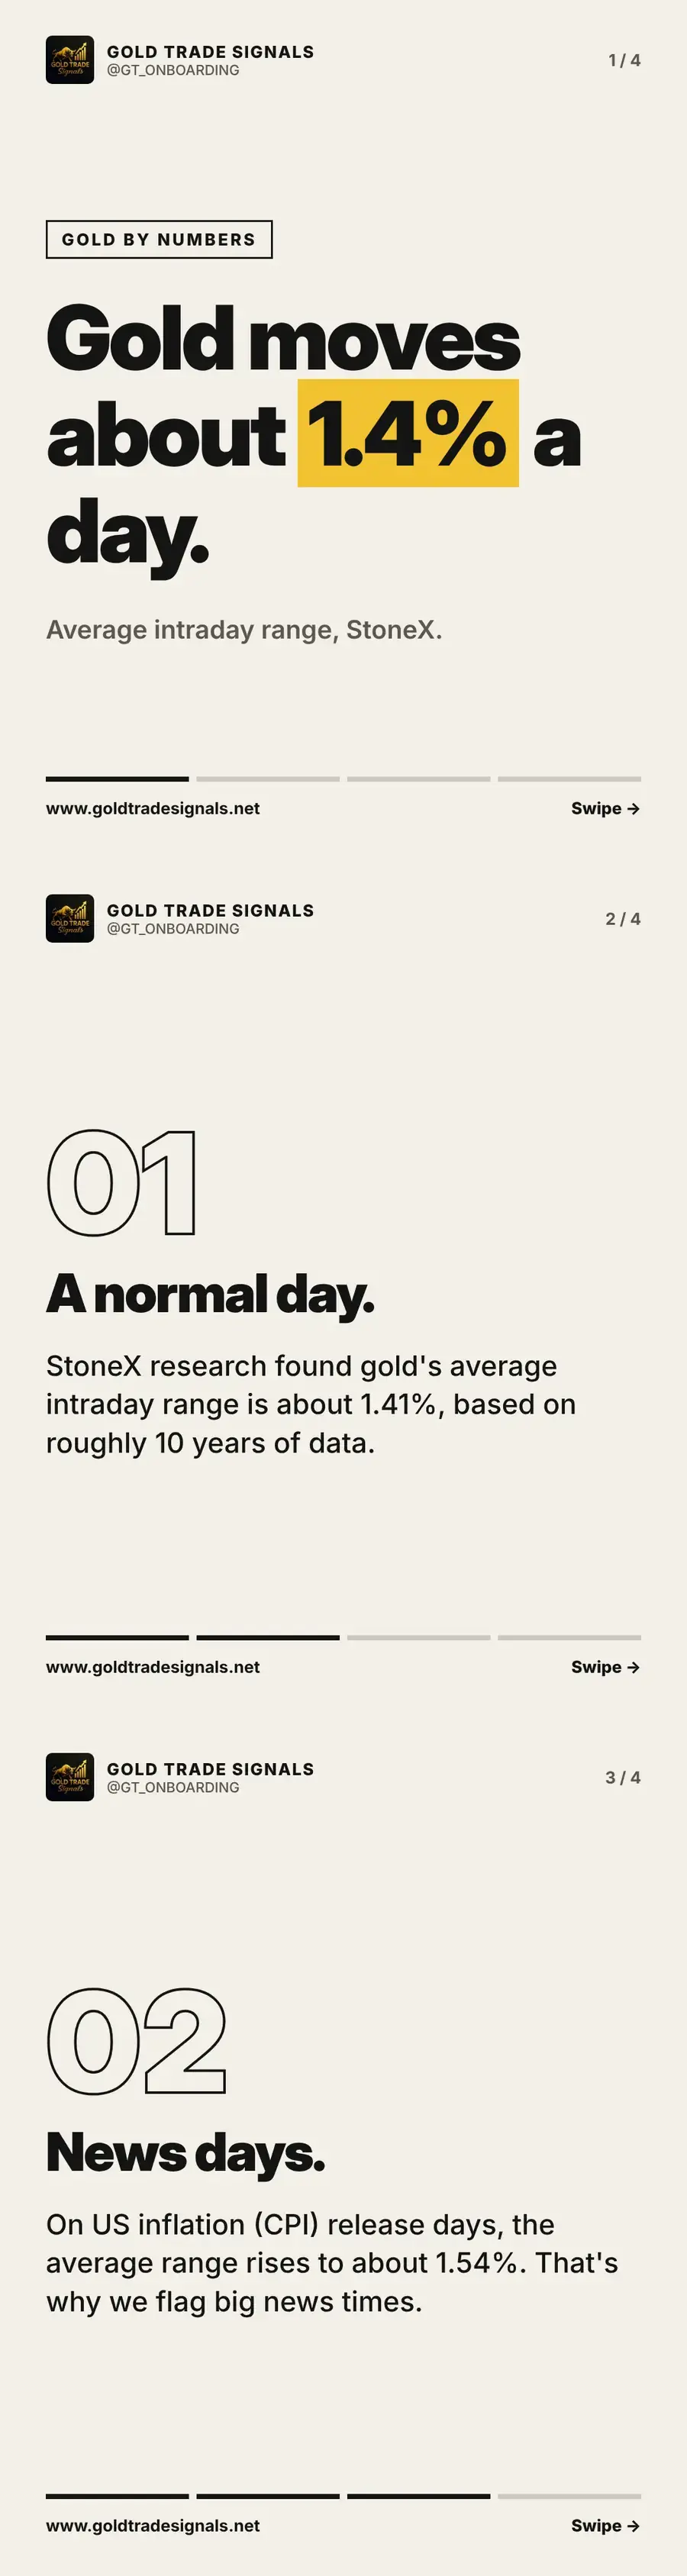
How much does gold move in a day? About 1.4% on average
StoneX research puts gold's average intraday range at about 1.41%, rising to about 1.54% on US inflation days. We explain what that means for your risk.
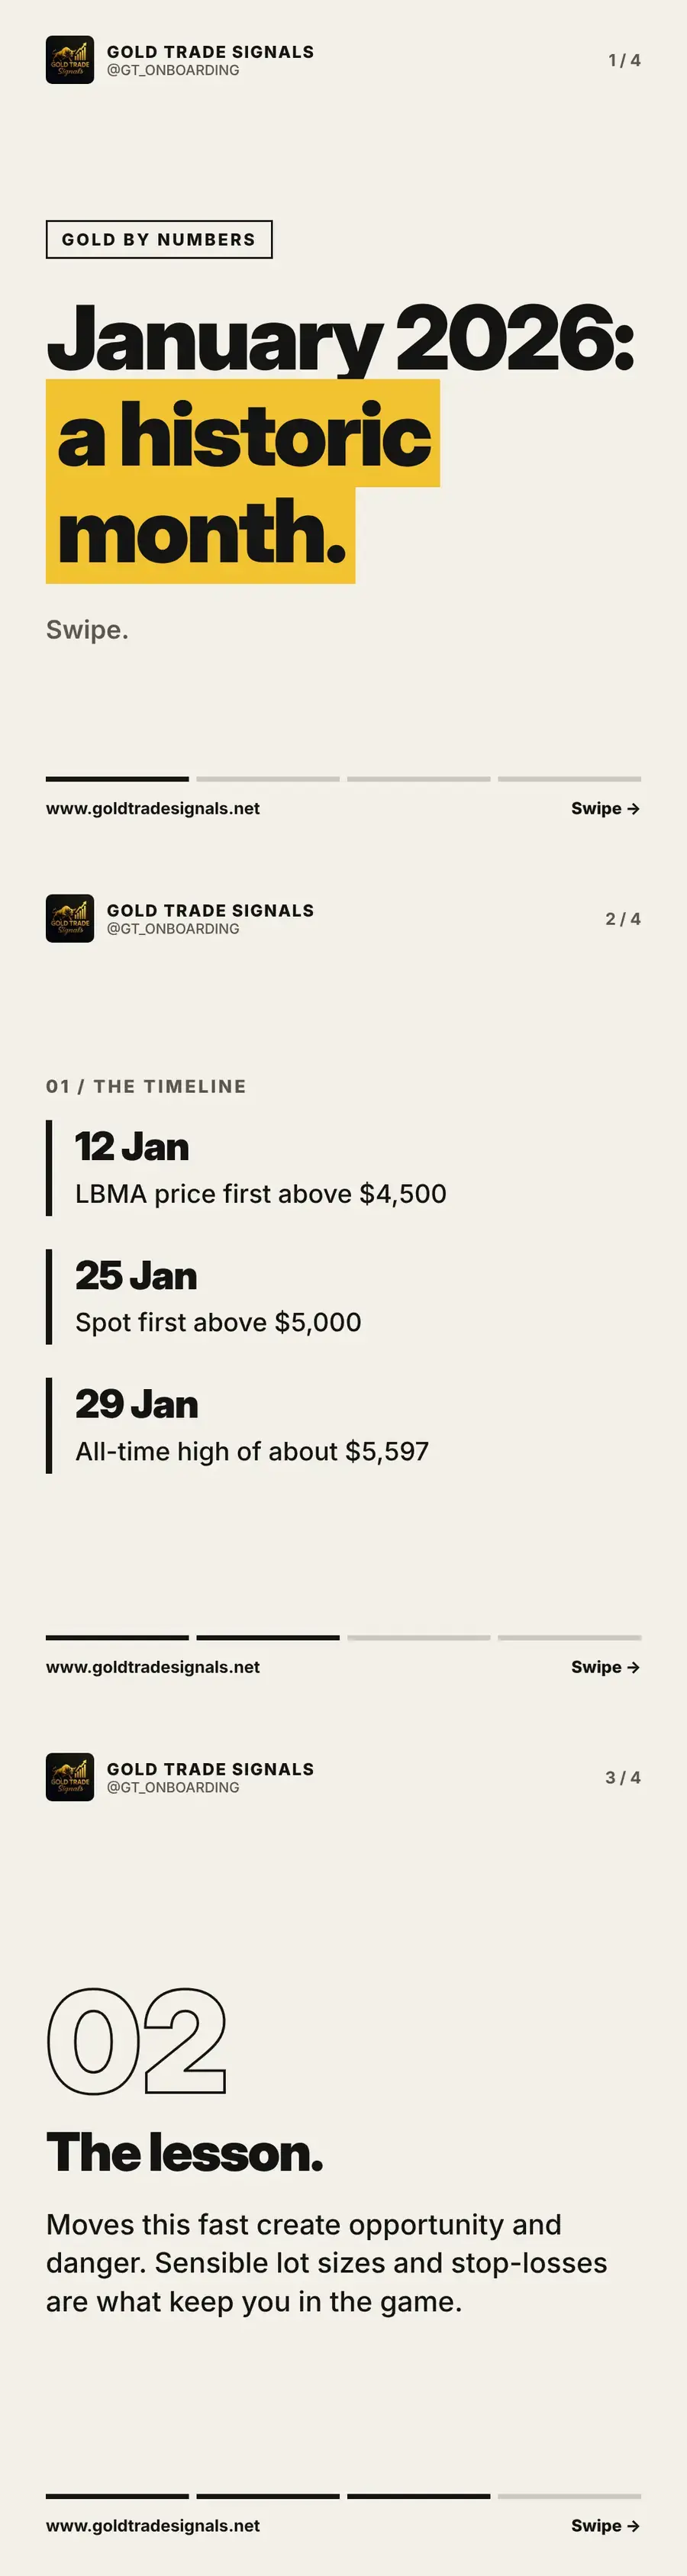
Gold's record January 2026: $4,500 to over $5,500 in two weeks
In January 2026 gold went from above $4,500 to a record of about $5,597 in about two weeks. We set out the timeline and the lesson for fast markets.
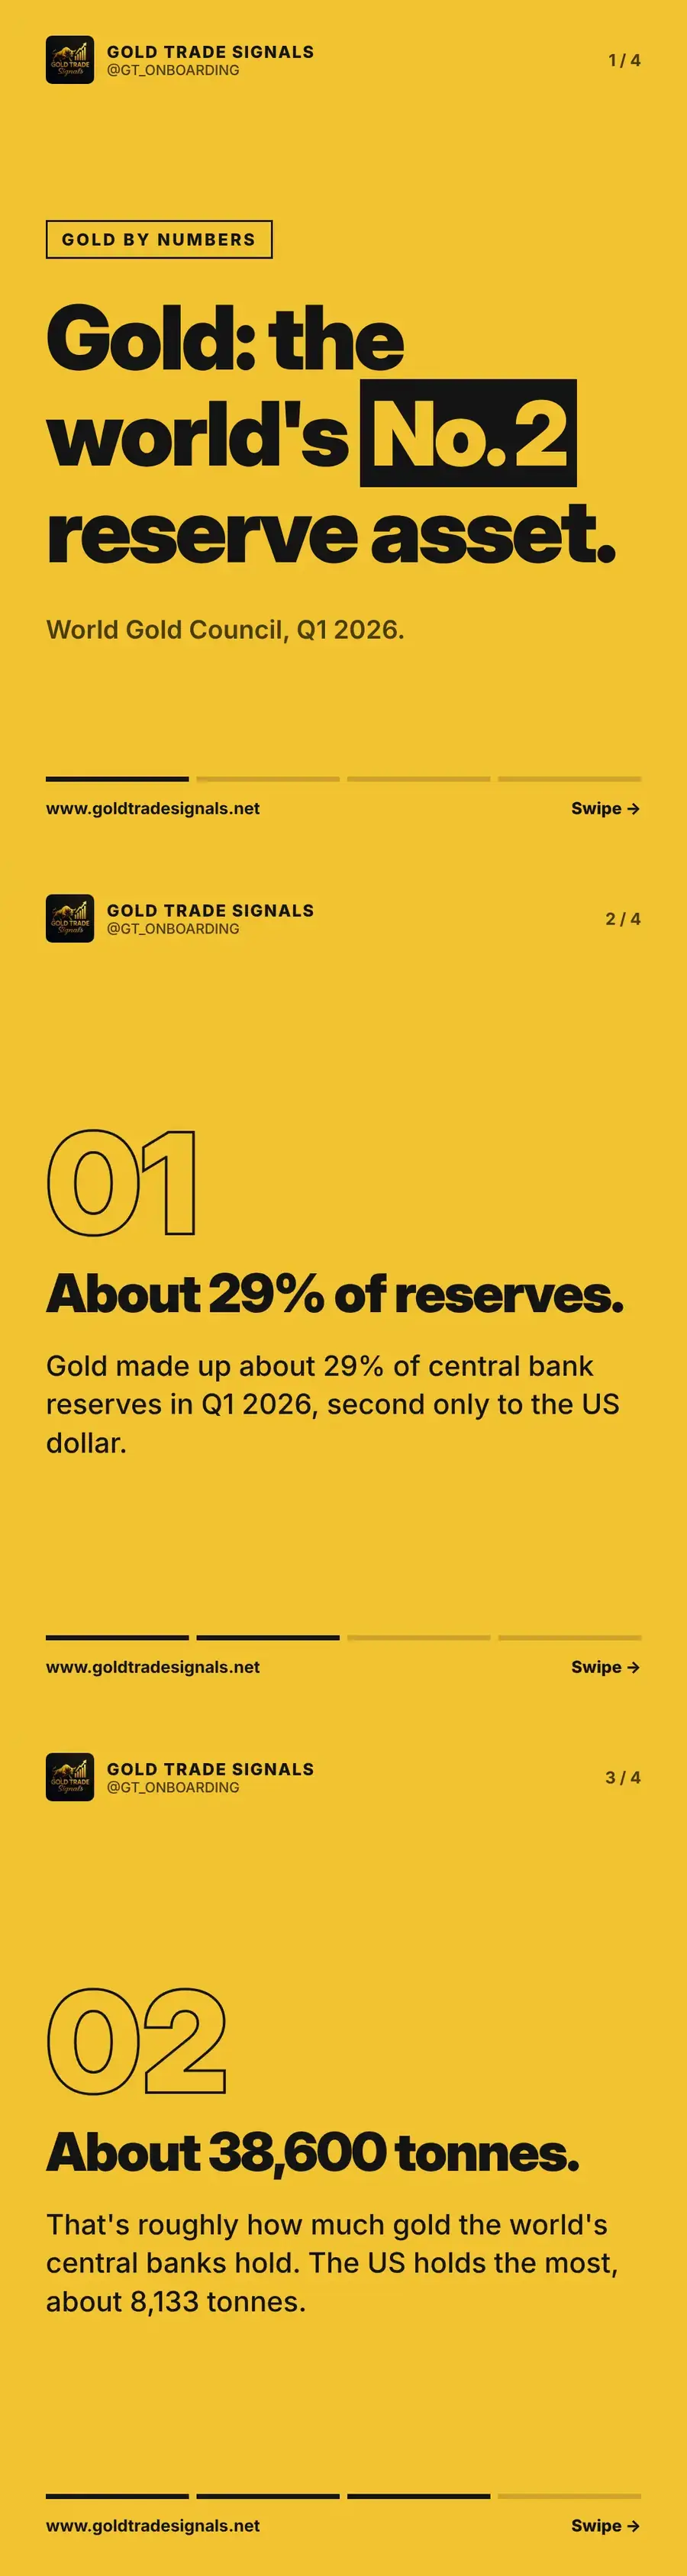
Gold is the world's second-largest reserve asset
Gold was about 29% of central bank reserves in Q1 2026, second only to the US dollar, with roughly 38,600 tonnes held worldwide. What it means for traders.
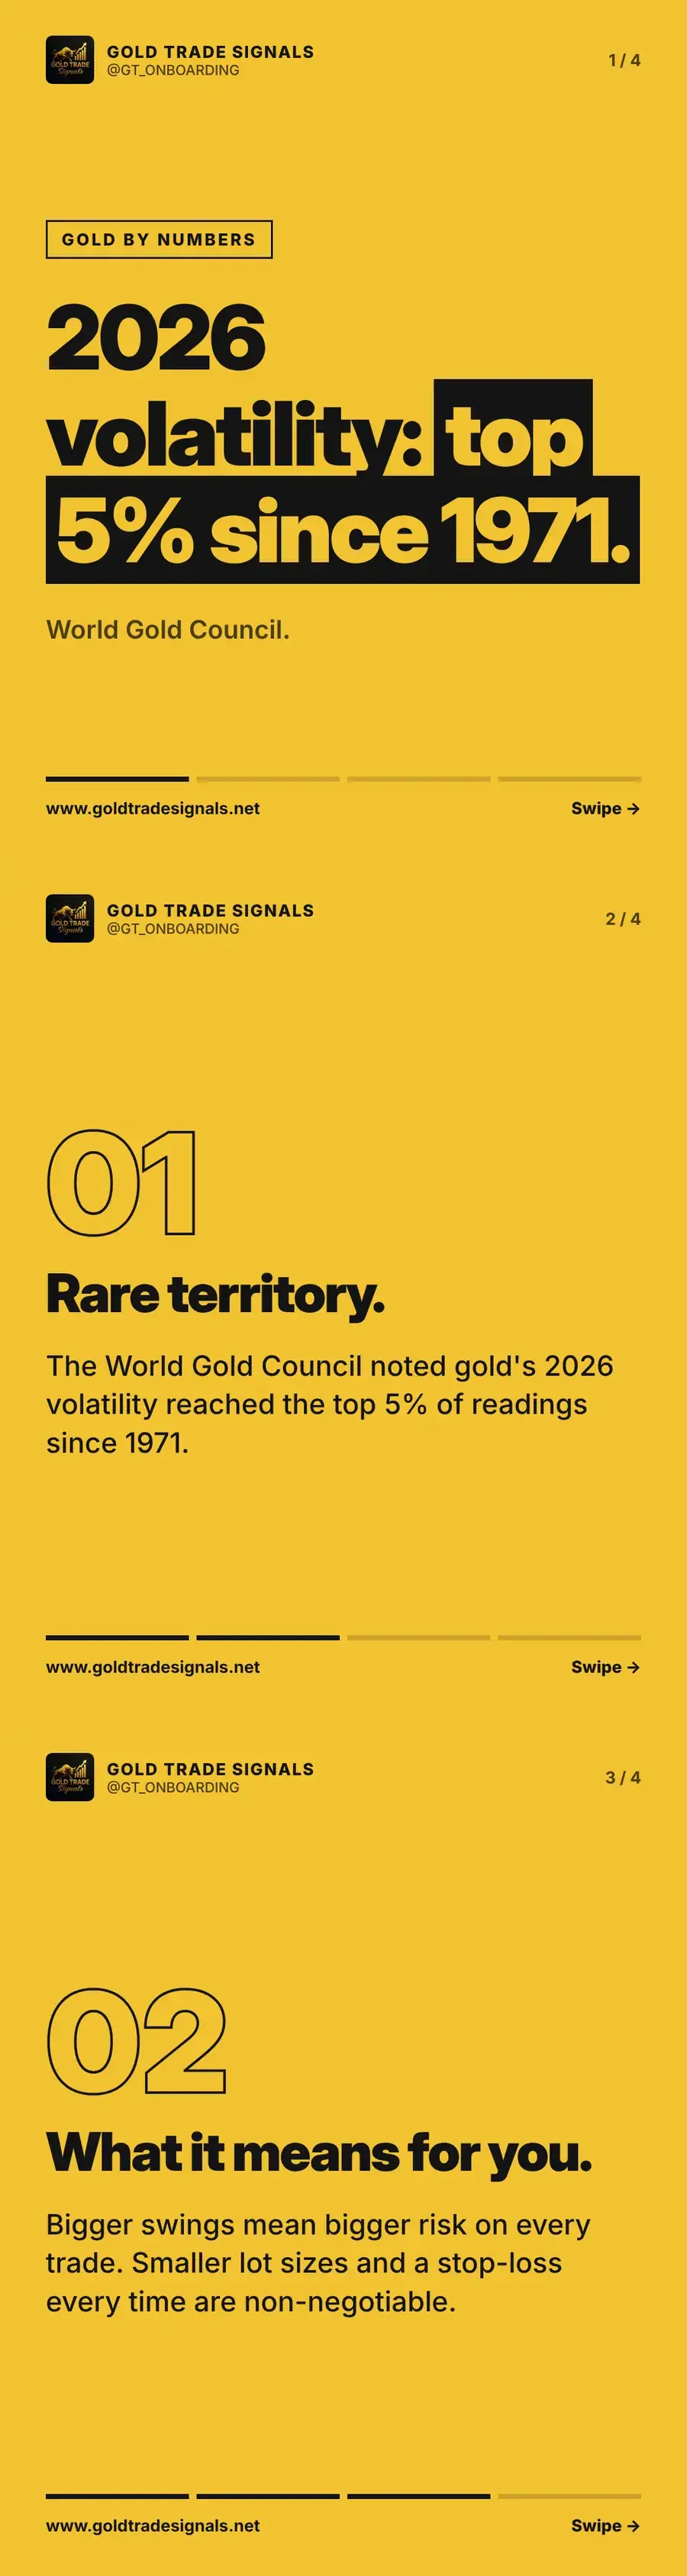
Gold volatility in 2026: top 5% of readings since 1971
The World Gold Council noted gold volatility in 2026 reached the top 5% of readings since 1971. What bigger swings mean for lot sizes and stop-losses.
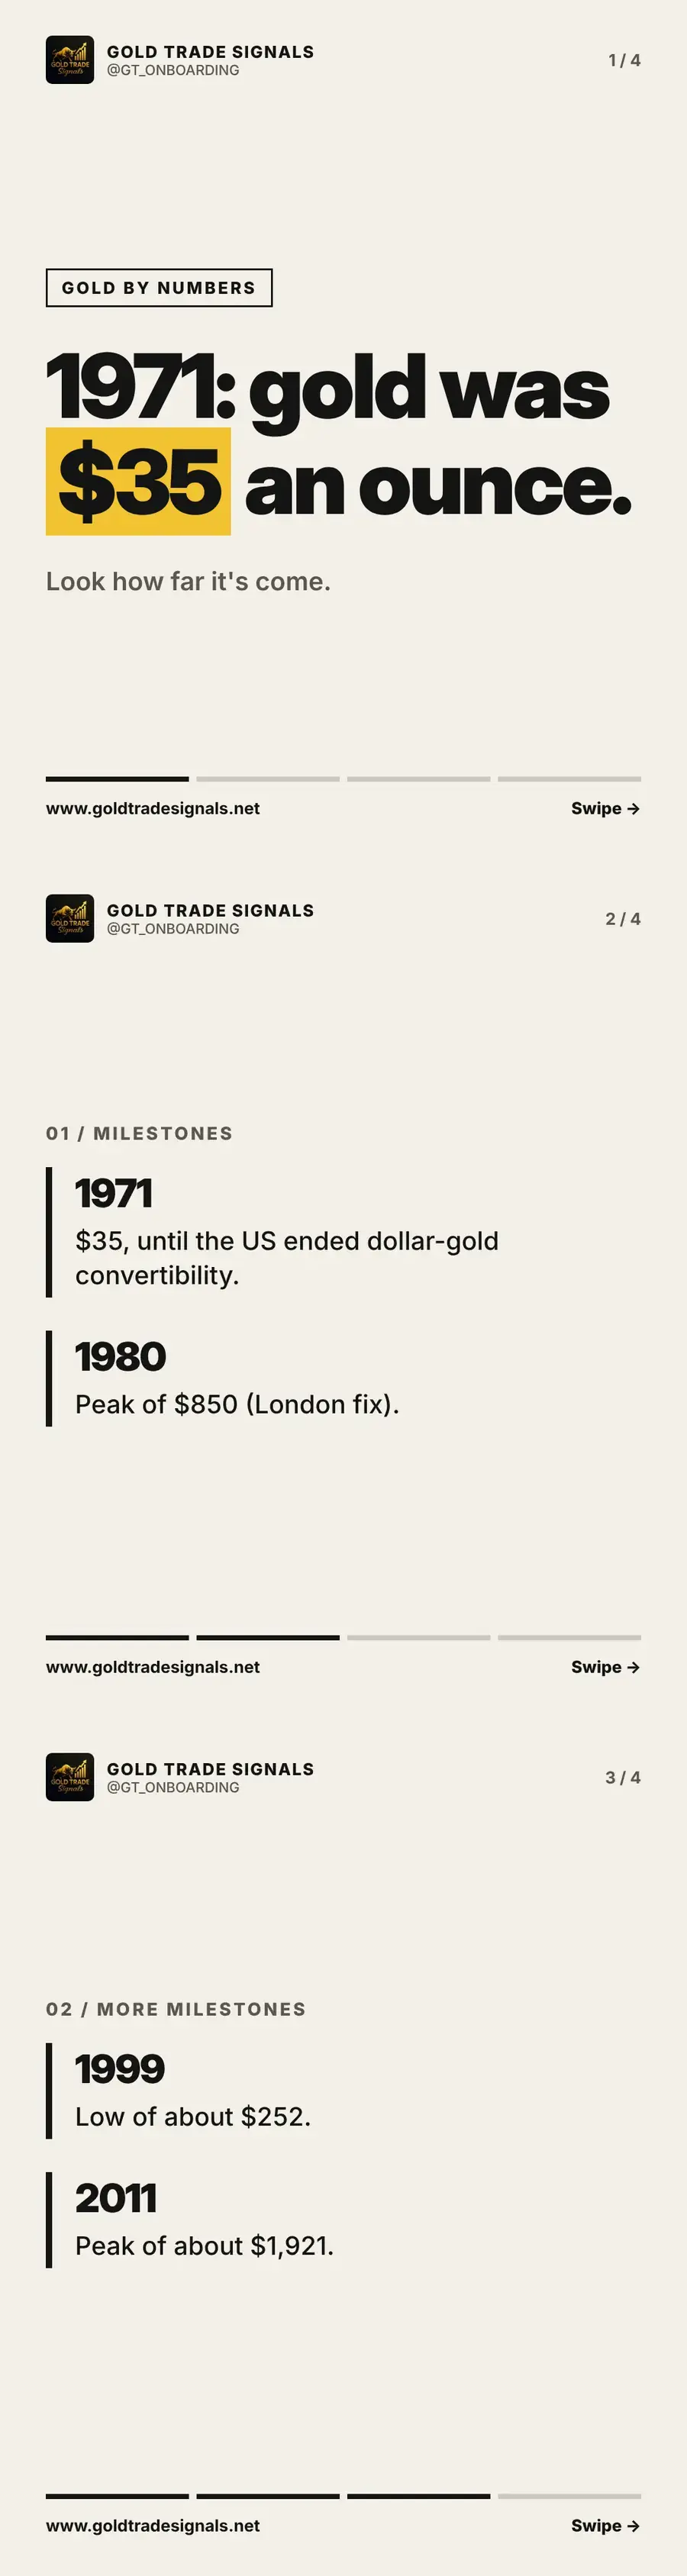
Gold price history: from $35 an ounce in 1971 to today
In 1971 gold was officially $35 an ounce. Follow the milestones since: the 1980 peak of $850, the 1999 low near $252 and the 2011 peak of about $1,921.
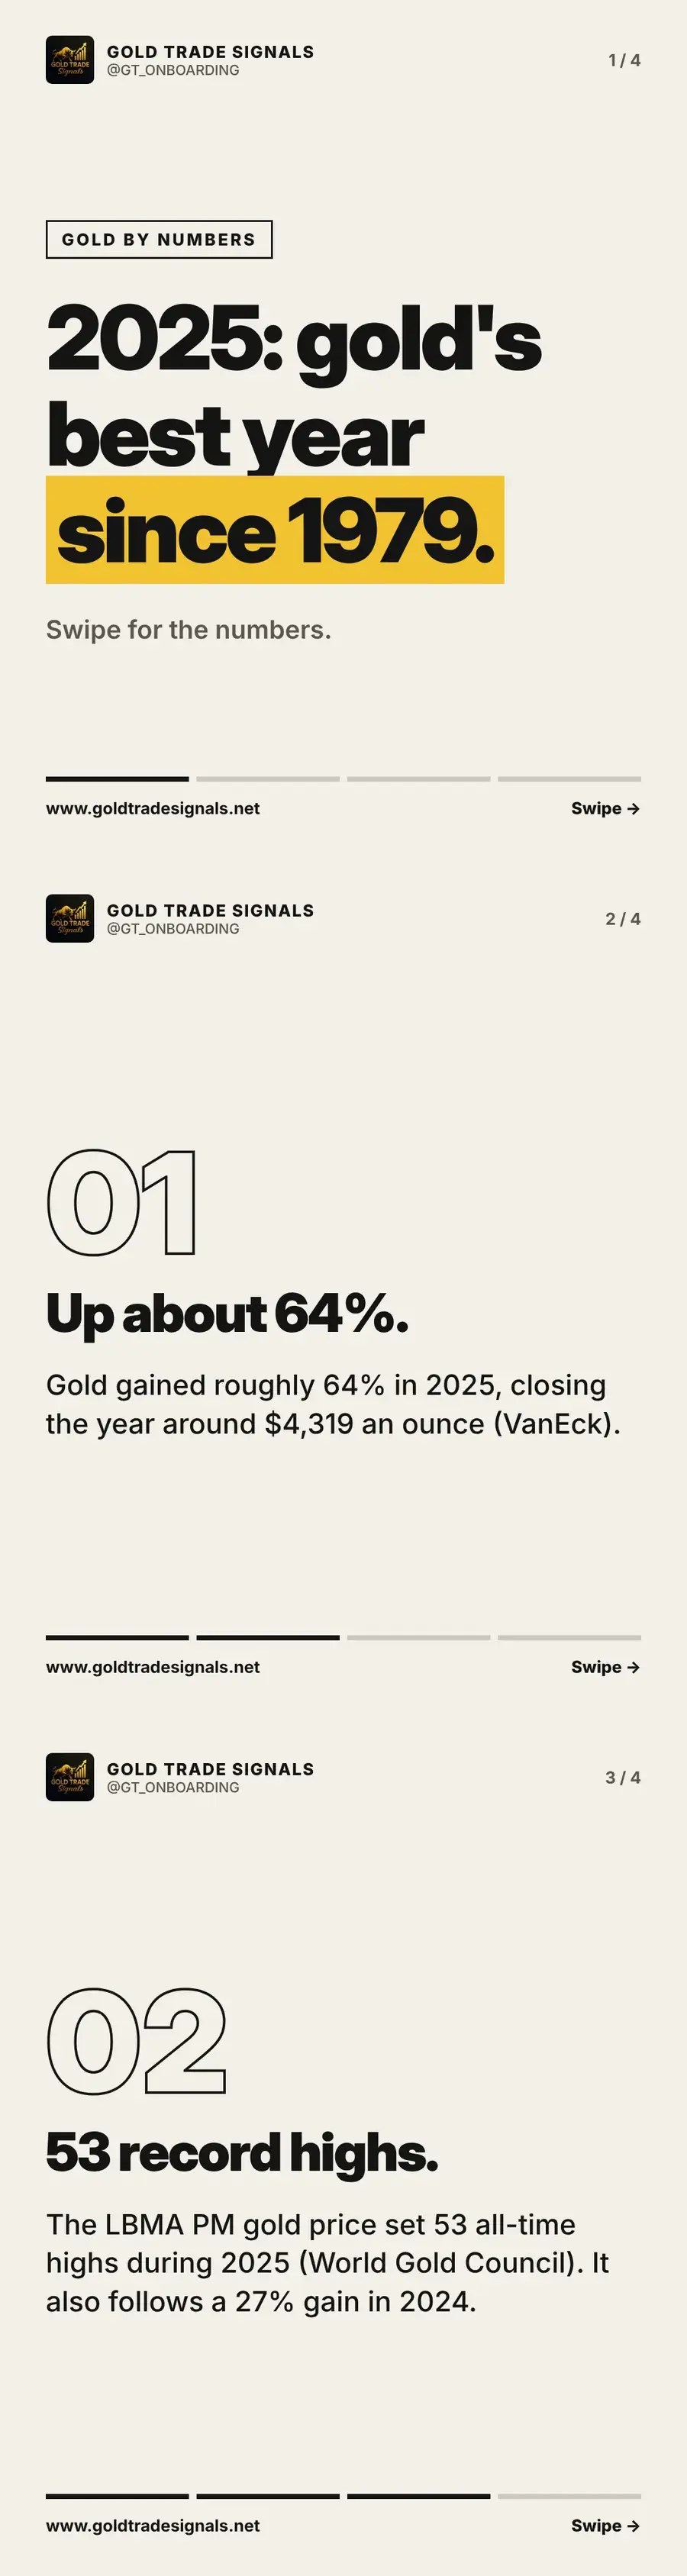
Gold in 2025: best year since 1979 with 53 record highs
Gold gained roughly 64% in 2025, closing around $4,319 an ounce, and set 53 all-time highs along the way. The numbers behind gold's best year since 1979.
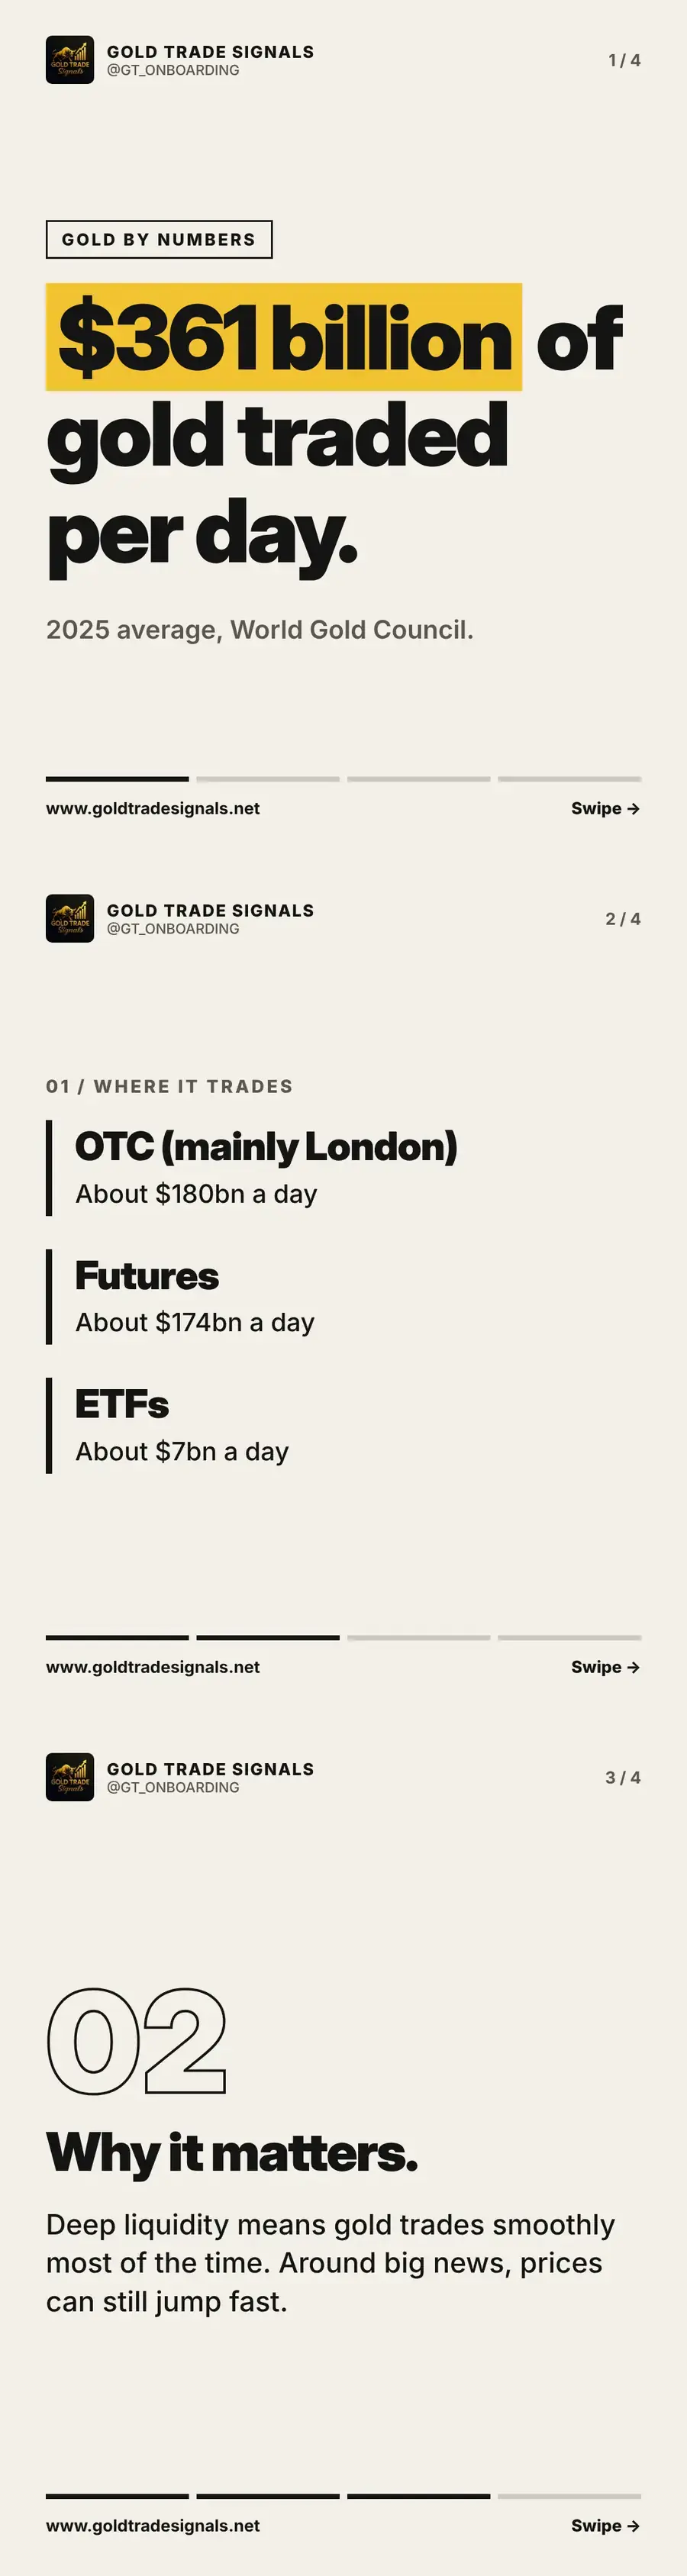
How much gold trades every day: around $361 billion
Around $361 billion of gold changes hands every day, split across OTC trading in London, futures and ETFs. Where it trades and why liquidity matters.
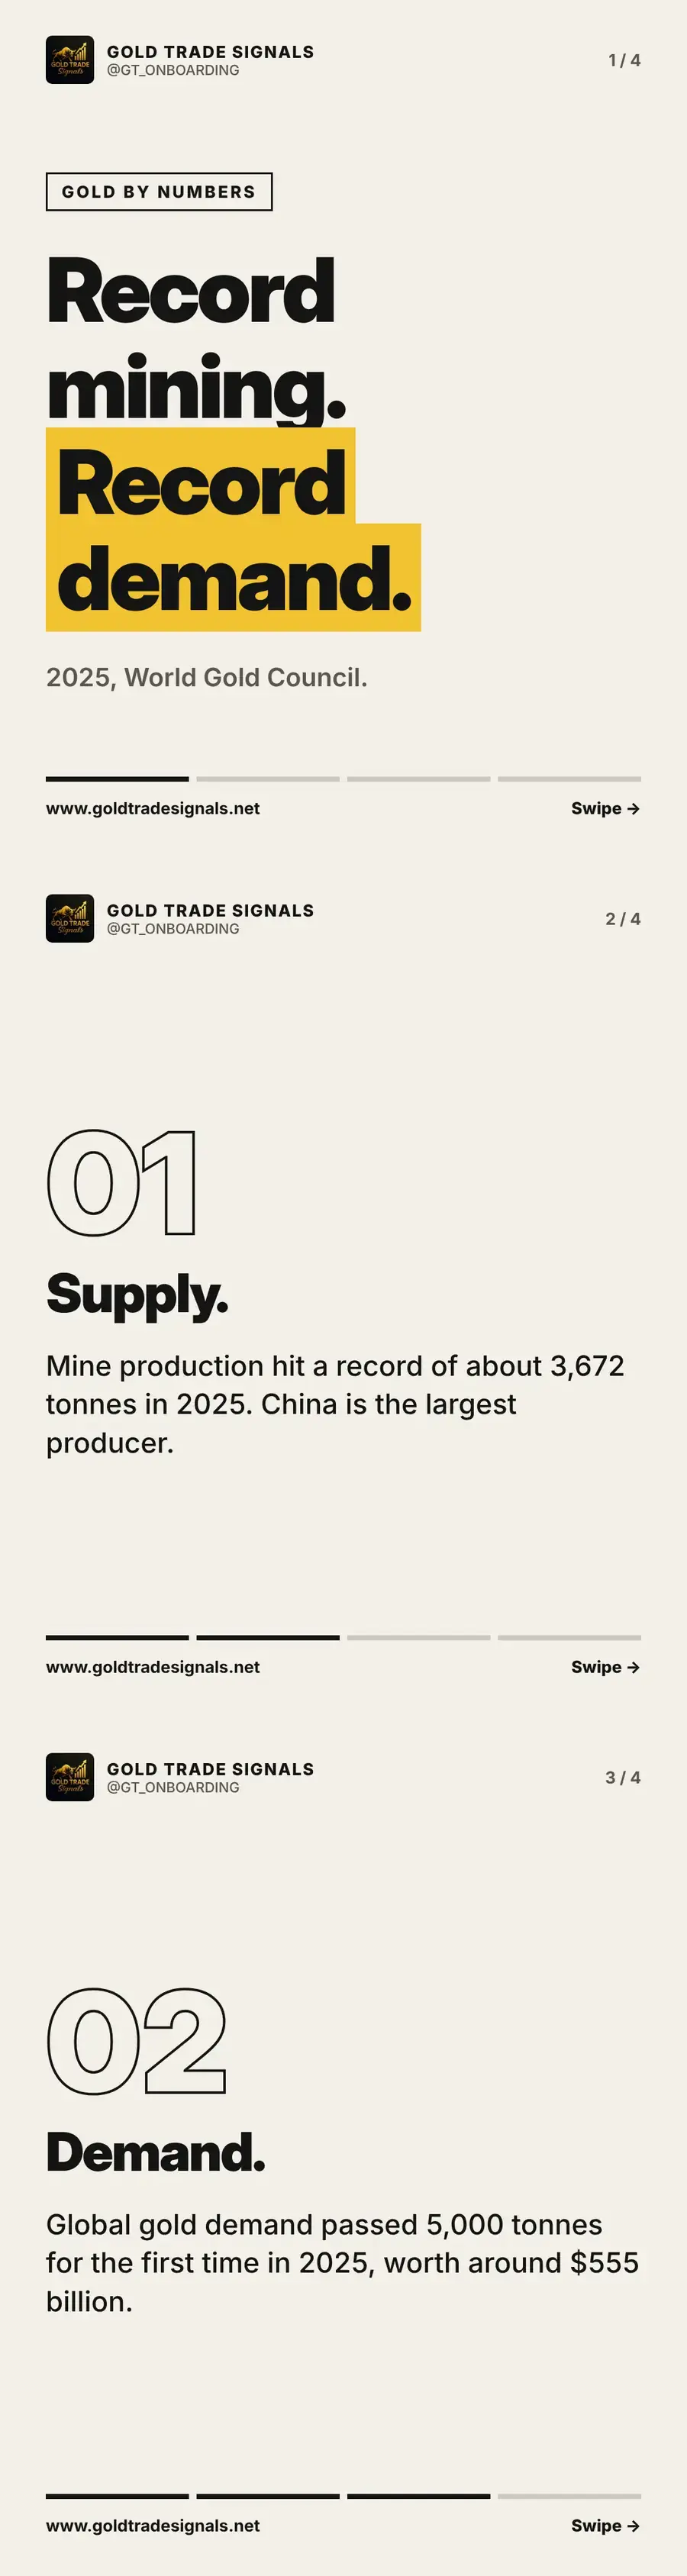
Record gold mining in 2025: 3,672 tonnes mined, demand past 5,000
Mine production hit a record of about 3,672 tonnes in 2025, and global demand passed 5,000 tonnes for the first time. What supply and demand numbers show.
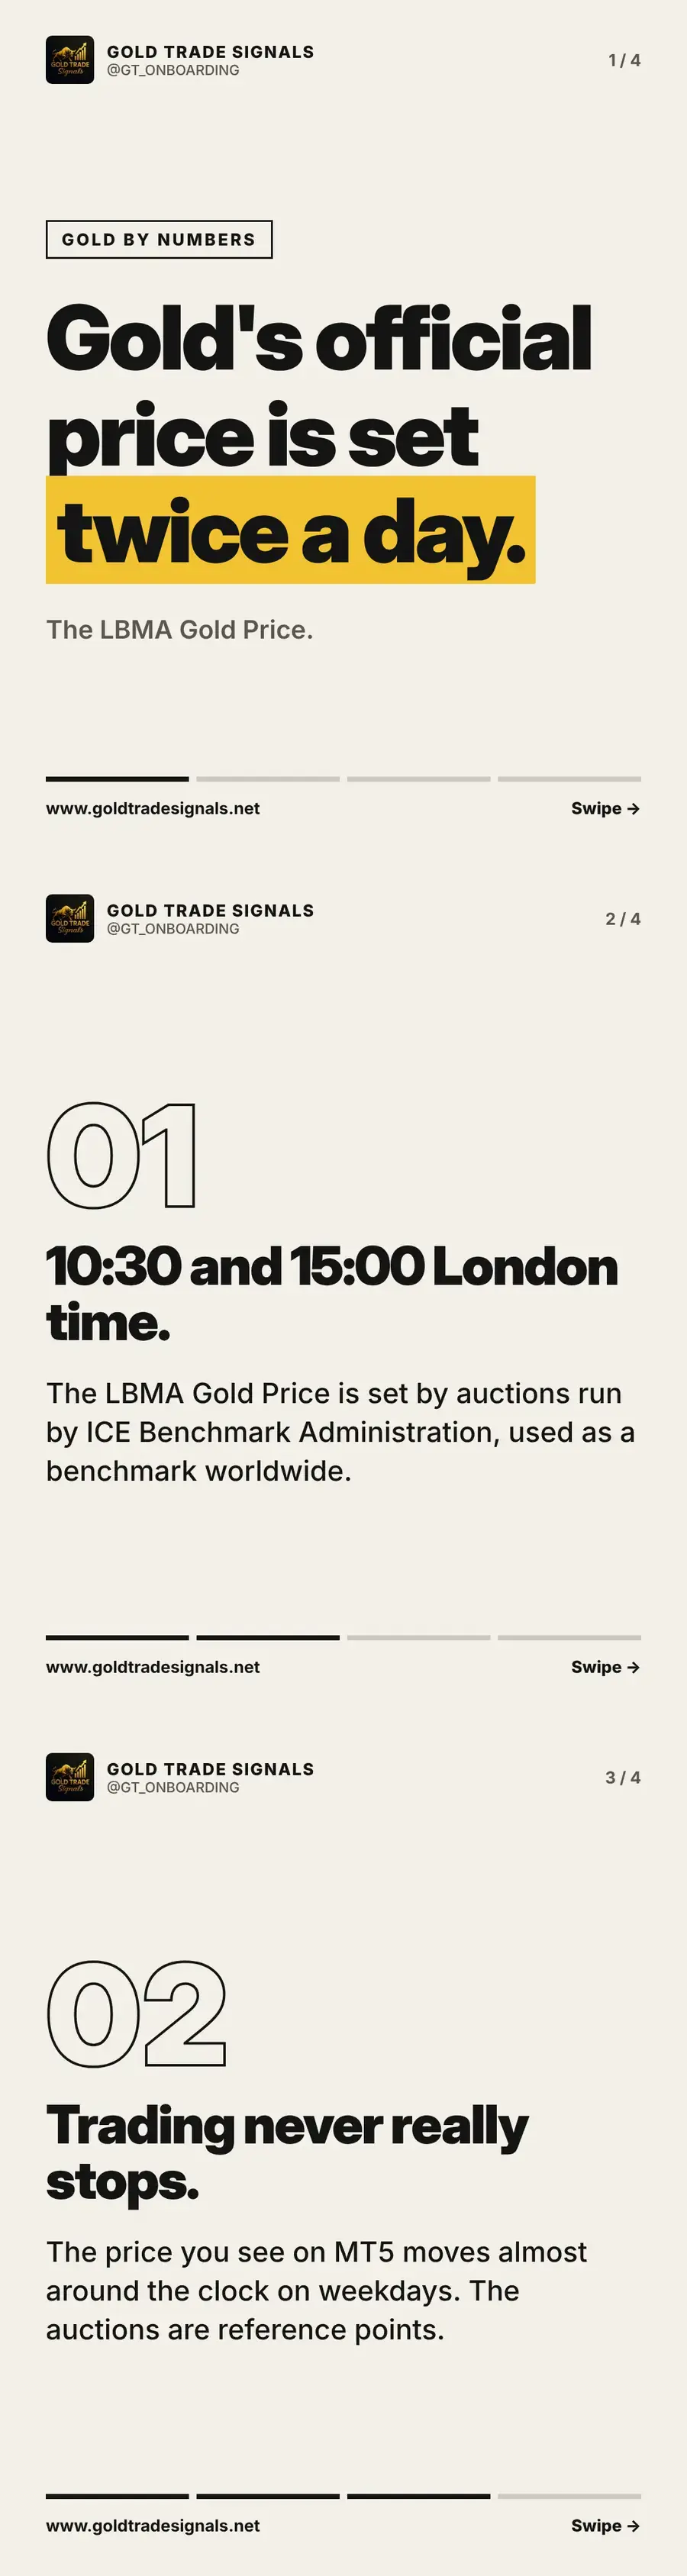
How the LBMA Gold Price is set twice a day in London
Gold's official price is set at 10:30 and 15:00 London time through auctions run by ICE Benchmark Administration. How it works and how it relates to MT5.
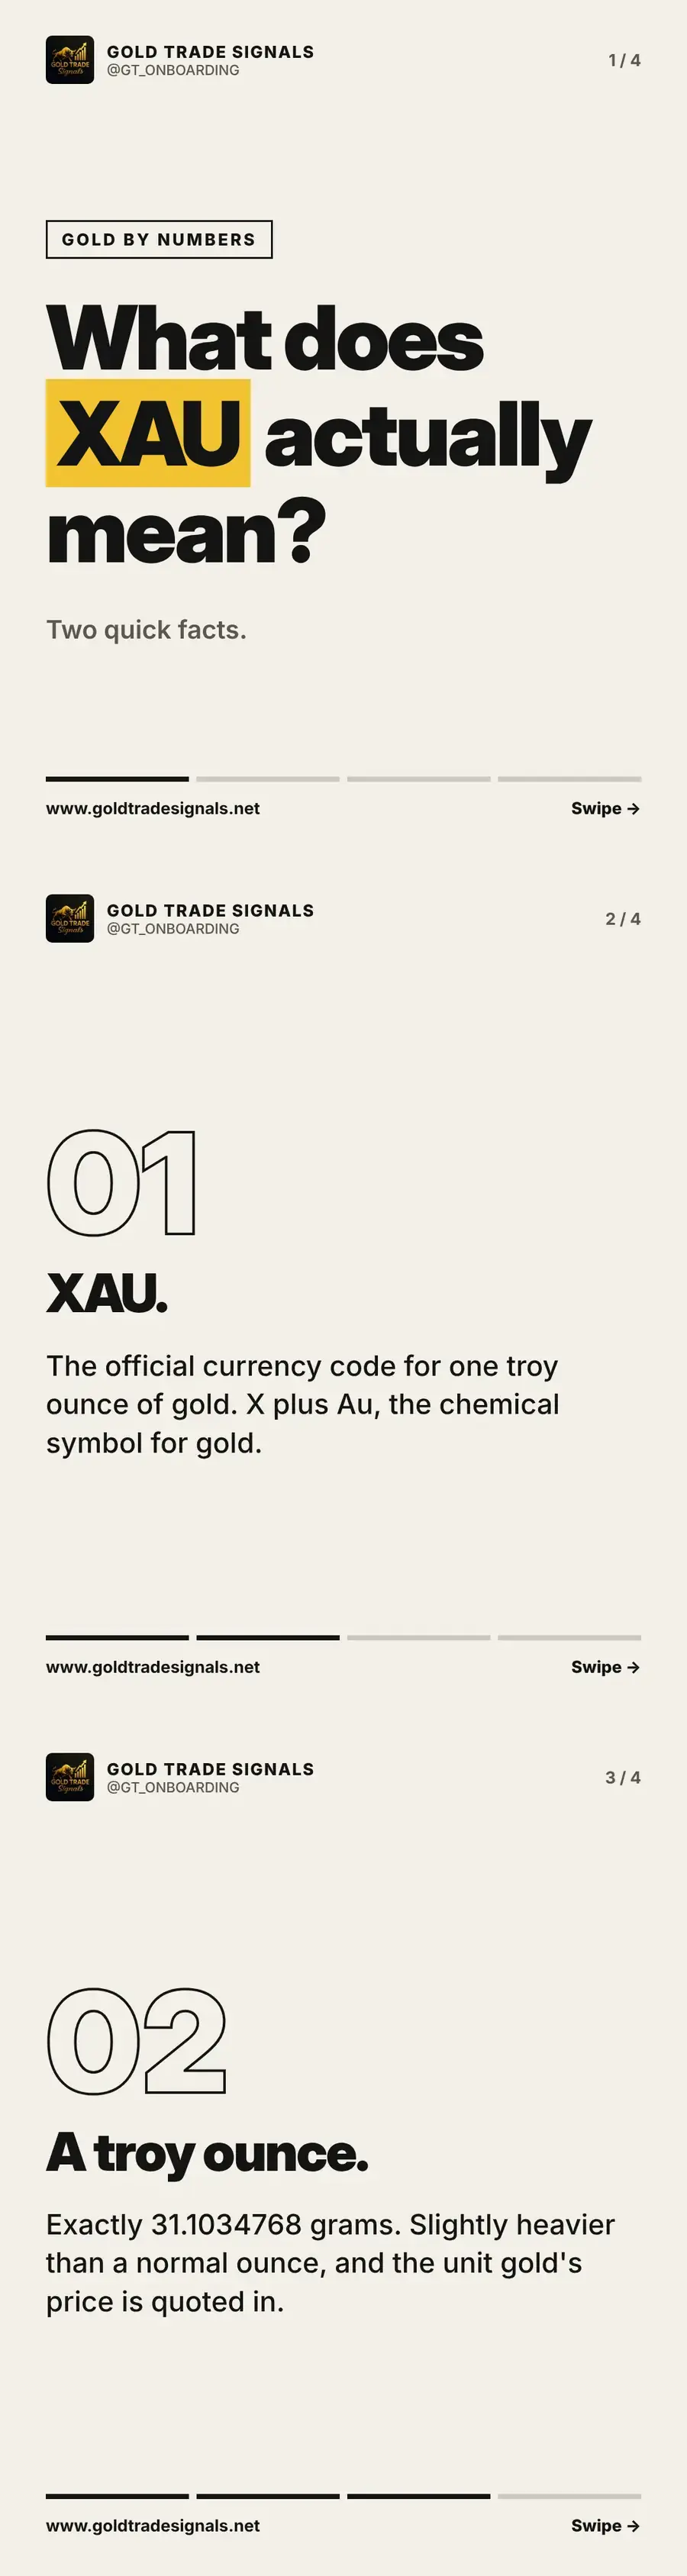
What XAU means and what a troy ounce actually is
XAU is the currency code for one troy ounce of gold, and a troy ounce is exactly 31.1034768 grams. Two facts every gold trader should know, explained.
Risk warning: This article is educational content, not personal investment advice. Gold is a leveraged, volatile instrument and you can lose some or all of your capital. Gold Trade Signals is not FCA regulated. Read the full risk warning.