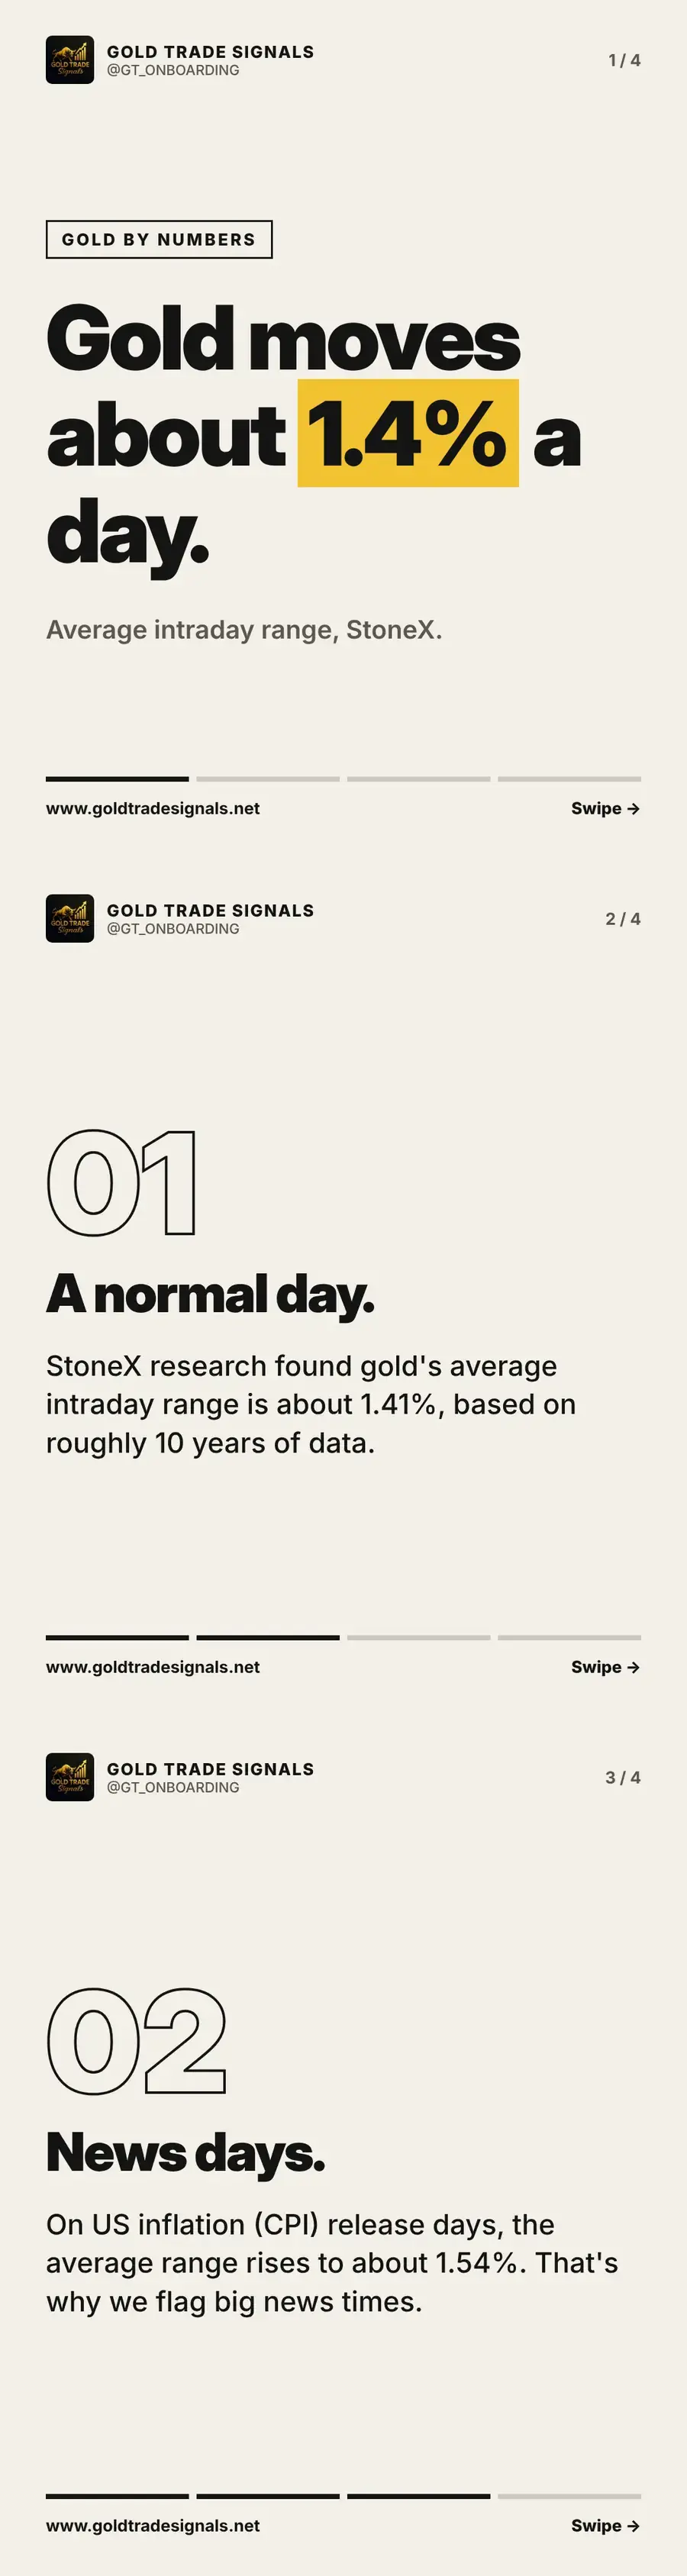
How much does gold move in a day? On average, about 1.4%, and more on big news days. In this article we look at the StoneX research behind that figure, explain what happens to the daily range when US inflation data is released, and show why knowing the typical range is the starting point for sensible risk.
A normal day
StoneX research found that gold's average intraday range is about 1.41%, based on roughly ten years of data. That is the typical distance between the day's high and low. On a market trading in the thousands of dollars an ounce, 1.41% is a move of well over fifty dollars, which is far more than many beginners expect when they first open a gold chart.
News days
On days when US inflation (CPI) figures are released, the same research shows the average range rises to about 1.54%. That is why we flag big news times in the group: the market is measurably more volatile, spreads can widen, and a stop-loss that looked comfortable on a quiet day can be reached much faster. Knowing the calendar lets you adjust or stay out.
Know your risk before you trade
The average range tells you how far gold can realistically travel against you in a single session. Use it to sense-check two things: whether your stop-loss is far enough away to survive normal noise, and whether your lot size keeps that stop-loss affordable. A trade sized for a quiet market can be painful on a CPI day. Know your risk before you trade, and every idea we send gives you the levels to do exactly that.
Key takeaways
- Gold's average intraday range is about 1.41% (StoneX, ten years of data)
- On US CPI days the average range rises to about 1.54%
- Use the typical range to sense-check your stop-loss and lot size
Common questions
What is the average daily range of gold?
About 1.41% between the day's high and low, according to StoneX research based on roughly ten years of data.
Does gold move more on news days?
Yes. On US CPI release days the average intraday range rises to about 1.54%, which is why we flag big news times.
Trade ideas with the levels already worked out
Join the free community and receive XAU/USD trade ideas with entry, stop-loss and take-profit, live training on Tuesdays and Thursdays, and support whenever you are stuck.
Join free on TelegramOpen the calculatorsRisk warning: This article is educational content, not personal investment advice. Gold is a leveraged, volatile instrument and you can lose some or all of your capital. Gold Trade Signals is not FCA regulated. Read the full risk warning.
More from Gold by Numbers
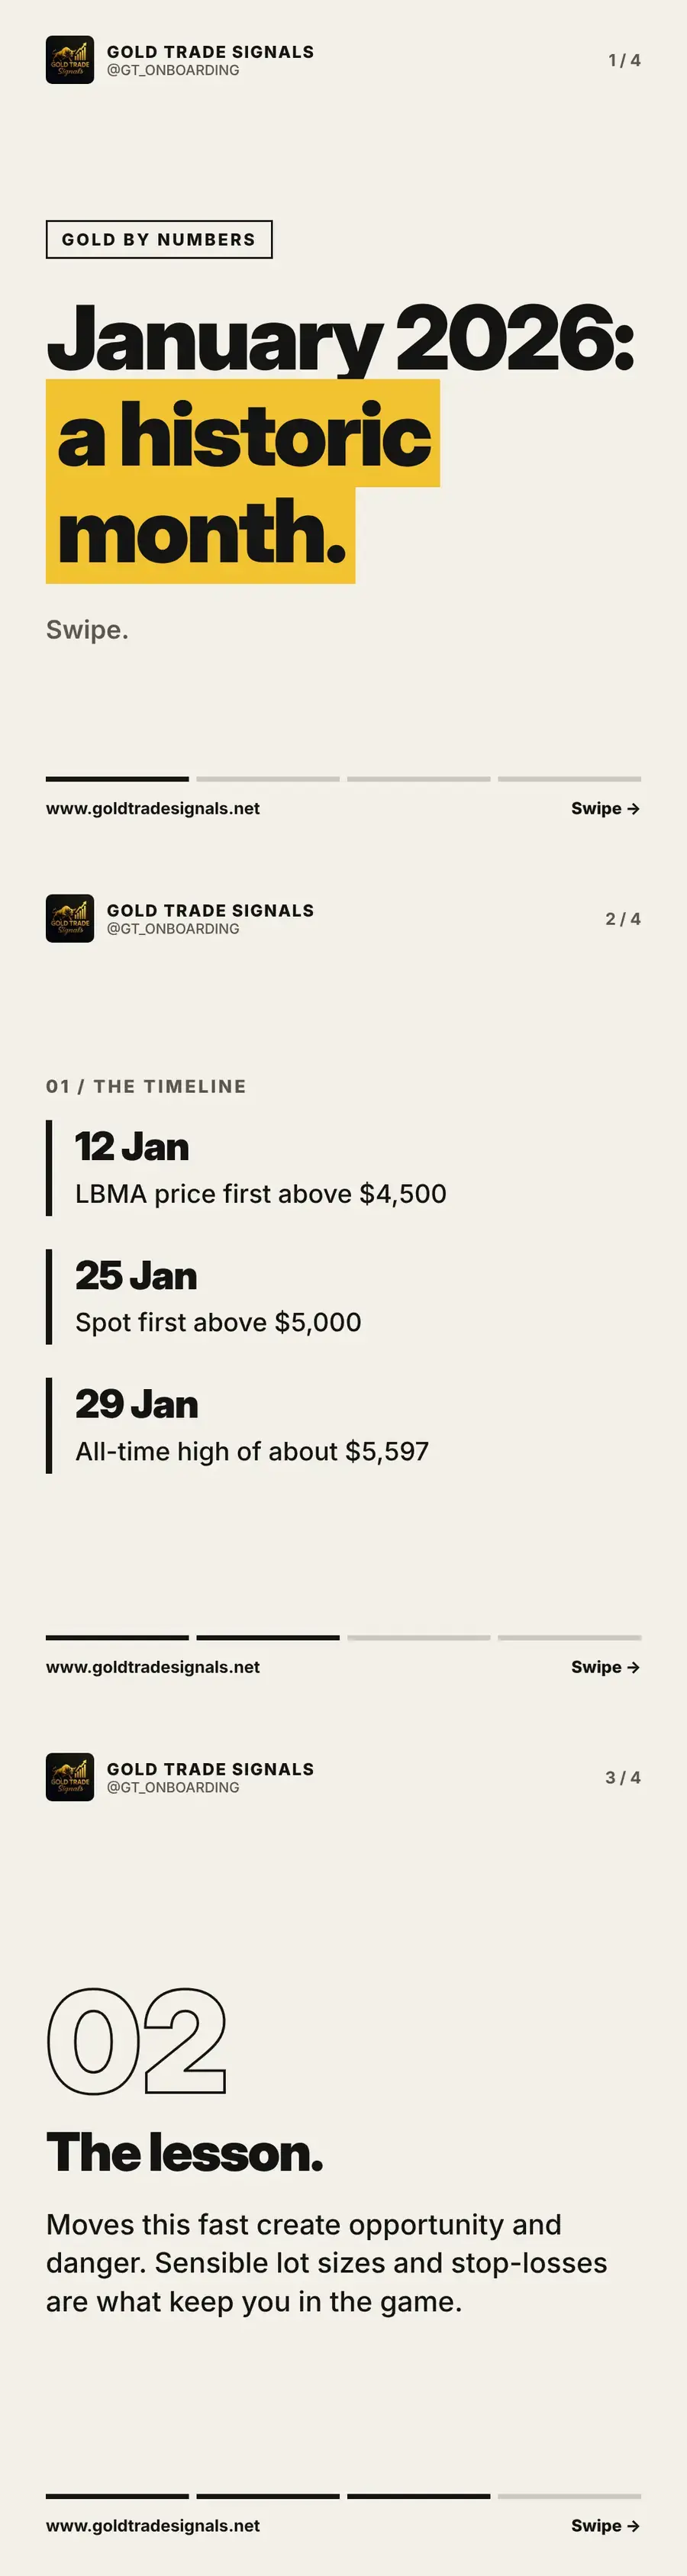
Gold's record January 2026: $4,500 to over $5,500 in two weeks
In January 2026 gold went from above $4,500 to a record of about $5,597 in about two weeks. We set out the timeline and the lesson for fast markets.
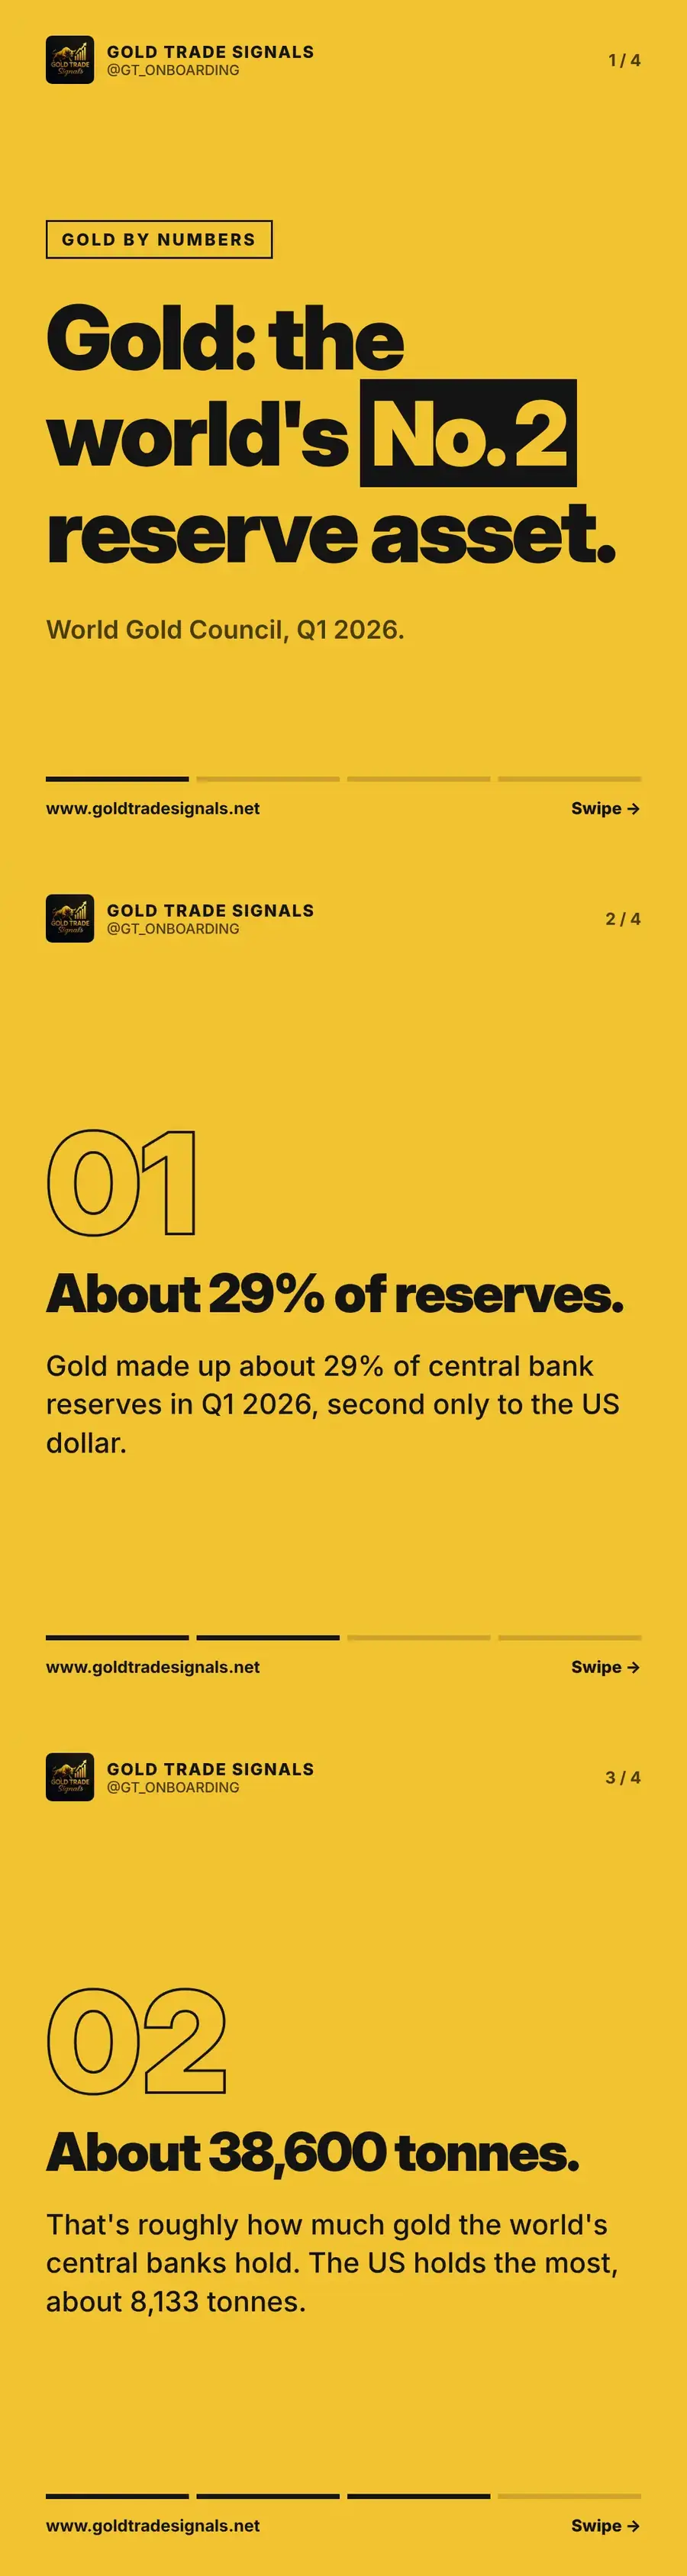
Gold is the world's second-largest reserve asset
Gold was about 29% of central bank reserves in Q1 2026, second only to the US dollar, with roughly 38,600 tonnes held worldwide. What it means for traders.
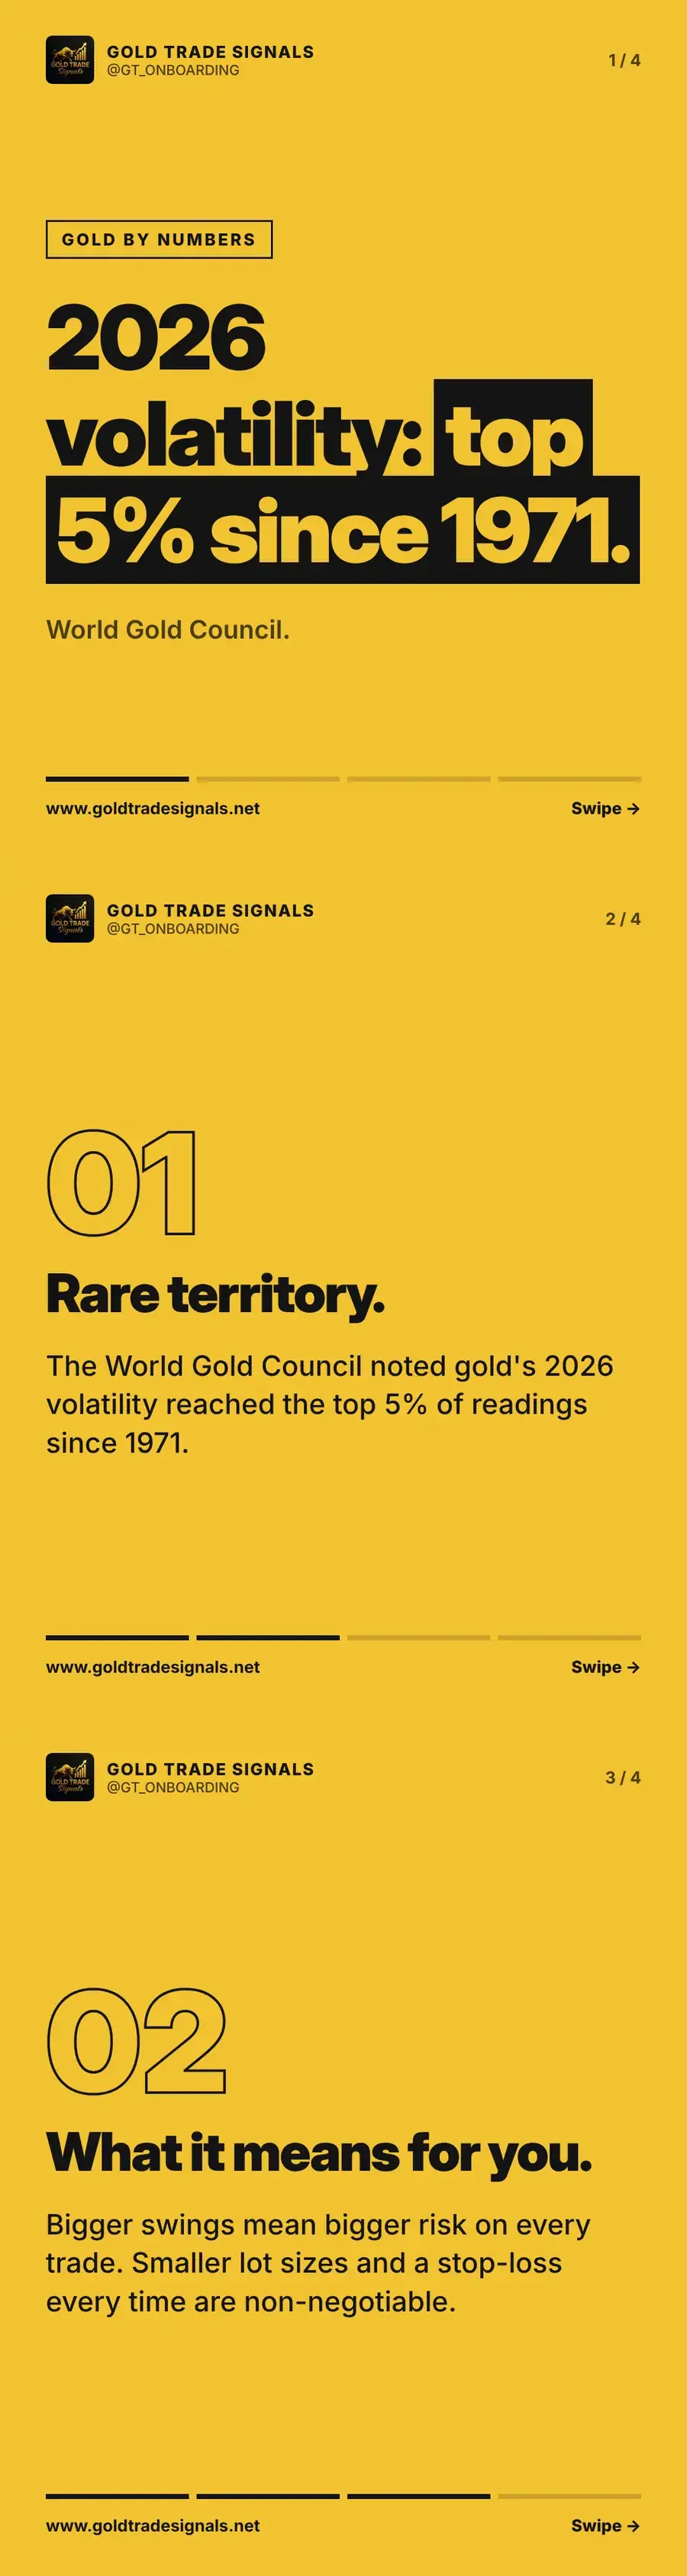
Gold volatility in 2026: top 5% of readings since 1971
The World Gold Council noted gold volatility in 2026 reached the top 5% of readings since 1971. What bigger swings mean for lot sizes and stop-losses.