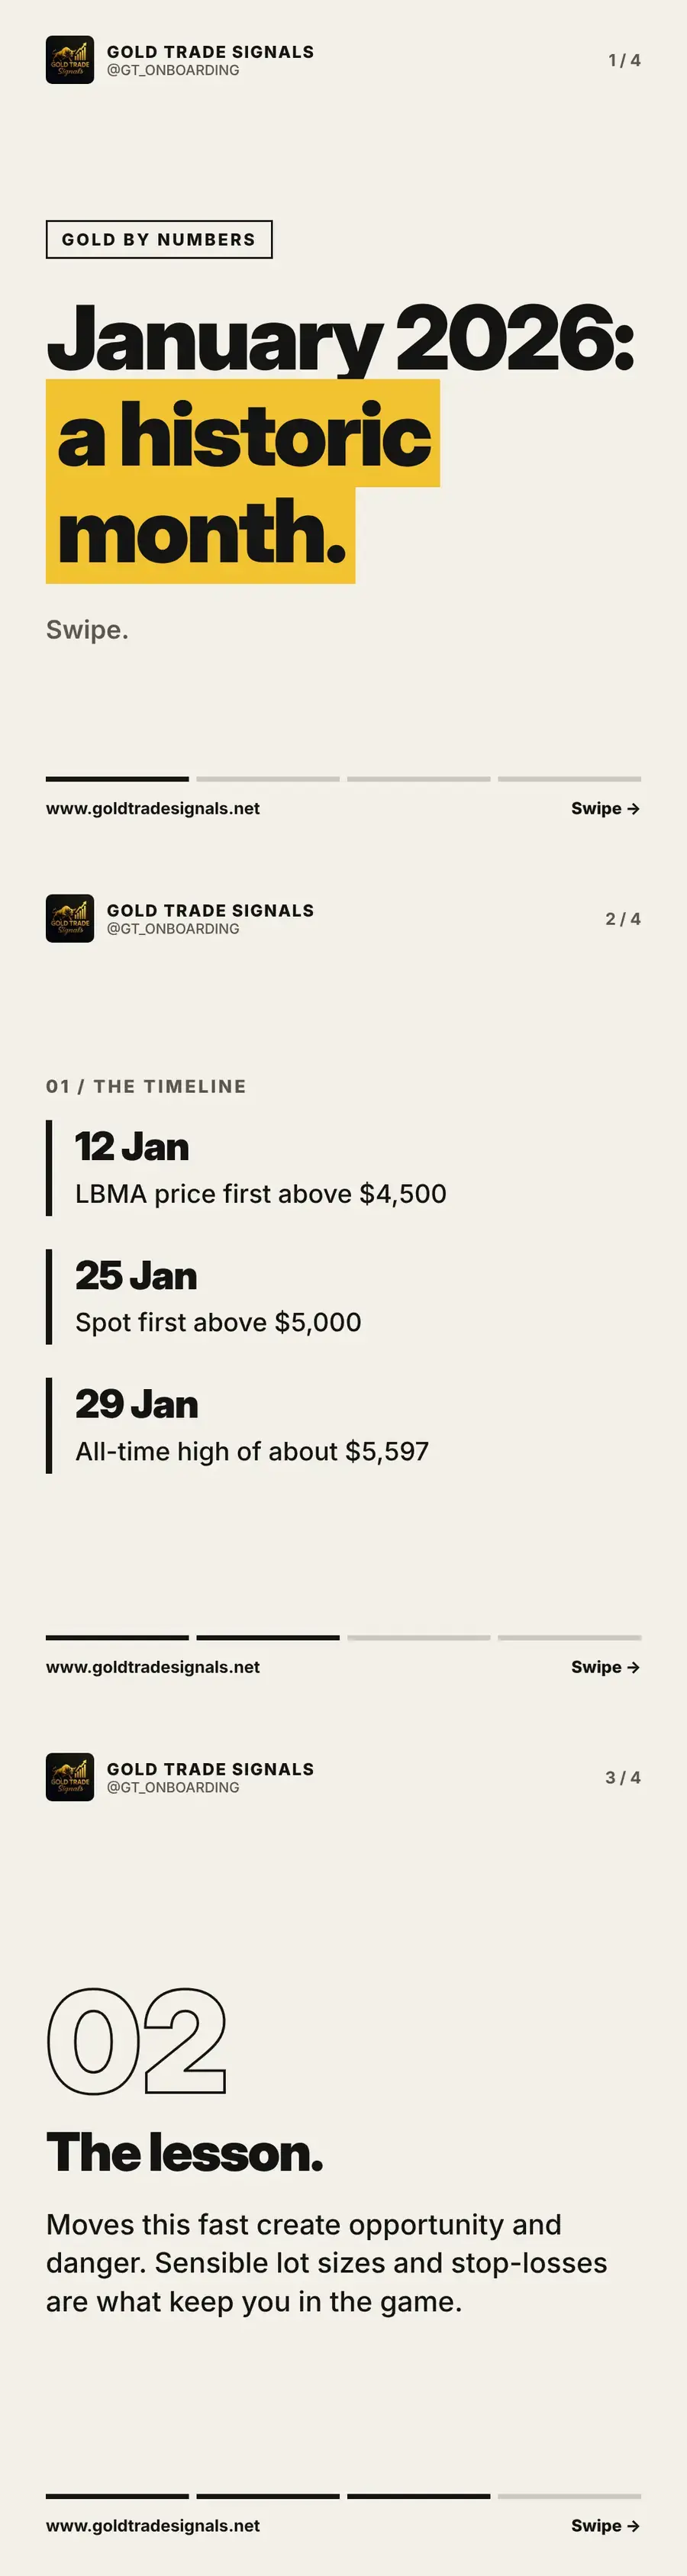
From $4,500 to over $5,500 in about two weeks: January 2026 was one of the wildest months in gold's history. In this article we set out the timeline of the three big levels gold crossed that month, and we explain why moves this fast create both opportunity and danger for anyone trading XAU/USD.
The timeline
On 12 January 2026, the LBMA gold price was first set above $4,500 an ounce. Thirteen days later, on 25 January, spot gold moved above $5,000 for the first time. Four days after that, on 29 January, gold printed an all-time high of about $5,597. Three major levels fell in under three weeks, in a market that had once taken years to add a single thousand dollars.
The lesson
Moves this fast create opportunity and danger in equal measure. A trade in the right direction can reach its take-profit quickly, but a trade in the wrong direction, or sized too large, can hit its stop-loss just as fast, and prices can jump past levels when volatility is this high. The traders who came through January 2026 well were the ones whose risk was decided before each trade.
Trading fast markets with a plan
Sensible lot sizes and stop-losses are what keep you in the game when gold is moving like this. A smaller lot means the larger daily ranges stay affordable; a stop-loss set at entry means a sudden reversal closes the trade at a loss you accepted rather than one you discover later. Every idea we send includes both, with a take-profit as well. Trade fast markets with a plan, because the market will not slow down for you.
Key takeaways
- 12 January 2026: LBMA price first above $4,500
- 25 January: spot first above $5,000; 29 January: record of about $5,597
- Fast moves bring opportunity and danger; lot size and stop-losses keep you in
Common questions
What happened to the gold price in January 2026?
Gold went from first crossing $4,500 on 12 January to an all-time high of about $5,597 on 29 January, passing $5,000 on 25 January.
How do you trade gold when it is moving fast?
Reduce lot size so larger ranges stay affordable, and set a stop-loss at entry so a sudden reversal closes the trade at a loss you planned.
Trade ideas with the levels already worked out
Join the free community and receive XAU/USD trade ideas with entry, stop-loss and take-profit, live training on Tuesdays and Thursdays, and support whenever you are stuck.
Join free on TelegramOpen the calculatorsRisk warning: This article is educational content, not personal investment advice. Gold is a leveraged, volatile instrument and you can lose some or all of your capital. Gold Trade Signals is not FCA regulated. Read the full risk warning.
More from Gold by Numbers
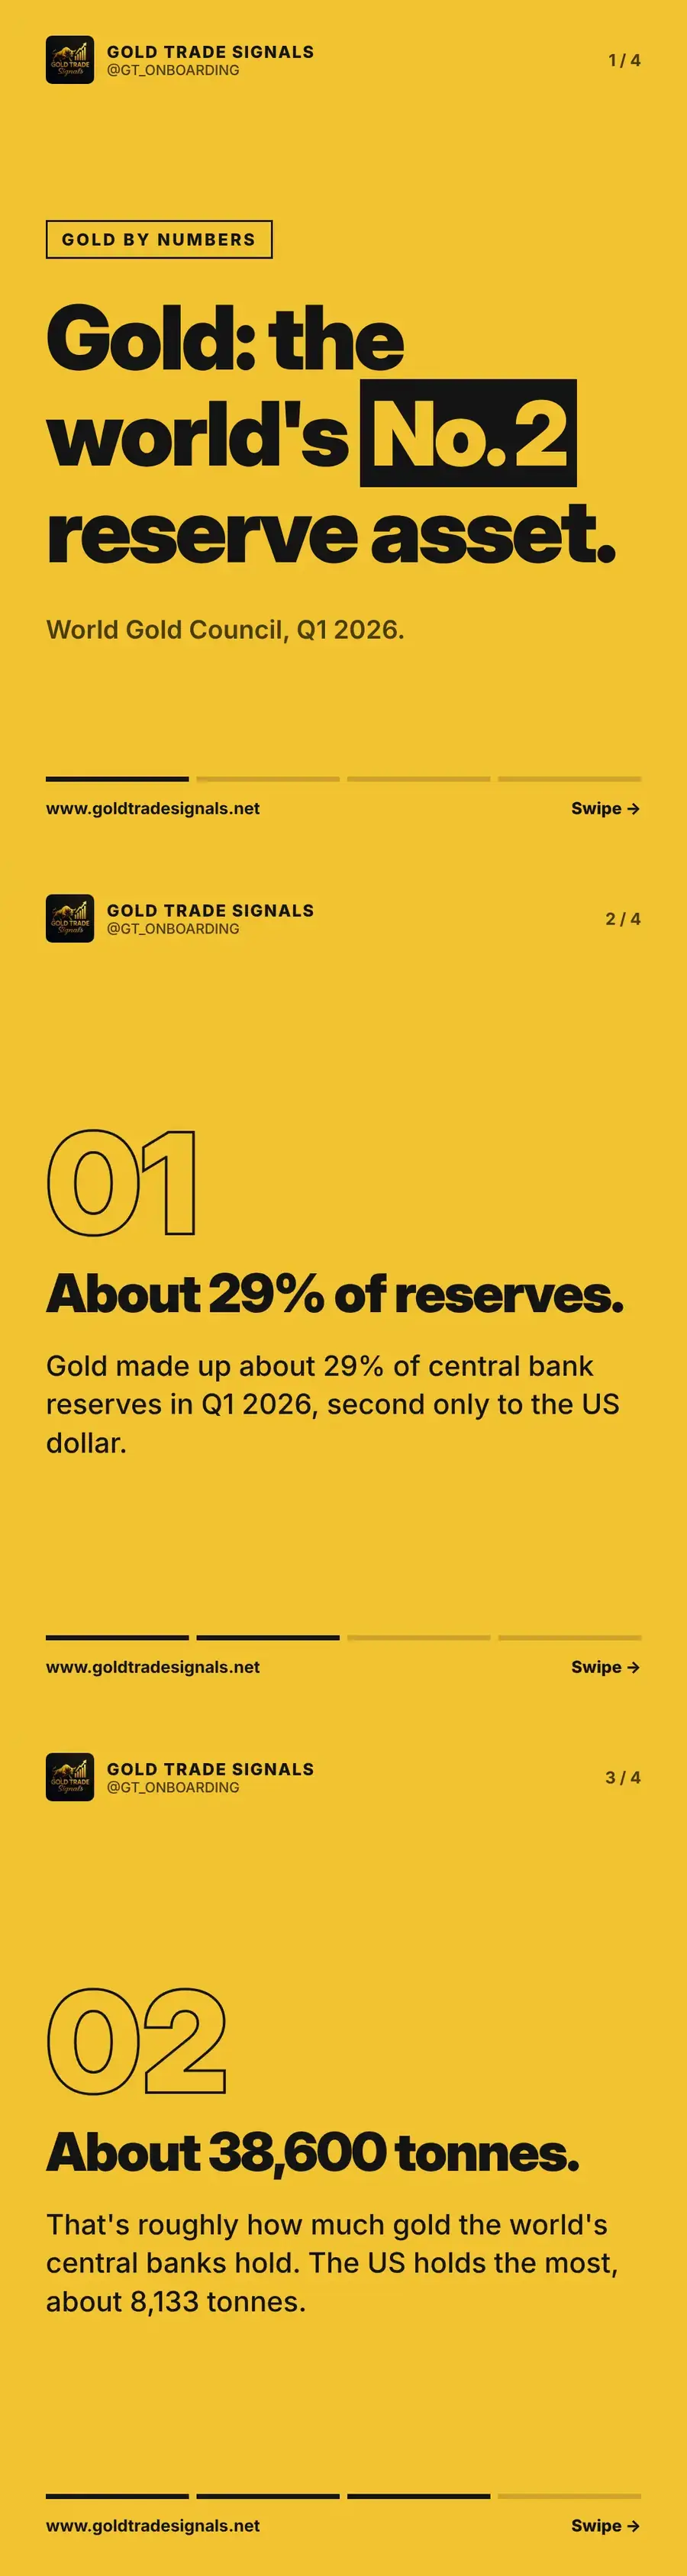
Gold is the world's second-largest reserve asset
Gold was about 29% of central bank reserves in Q1 2026, second only to the US dollar, with roughly 38,600 tonnes held worldwide. What it means for traders.
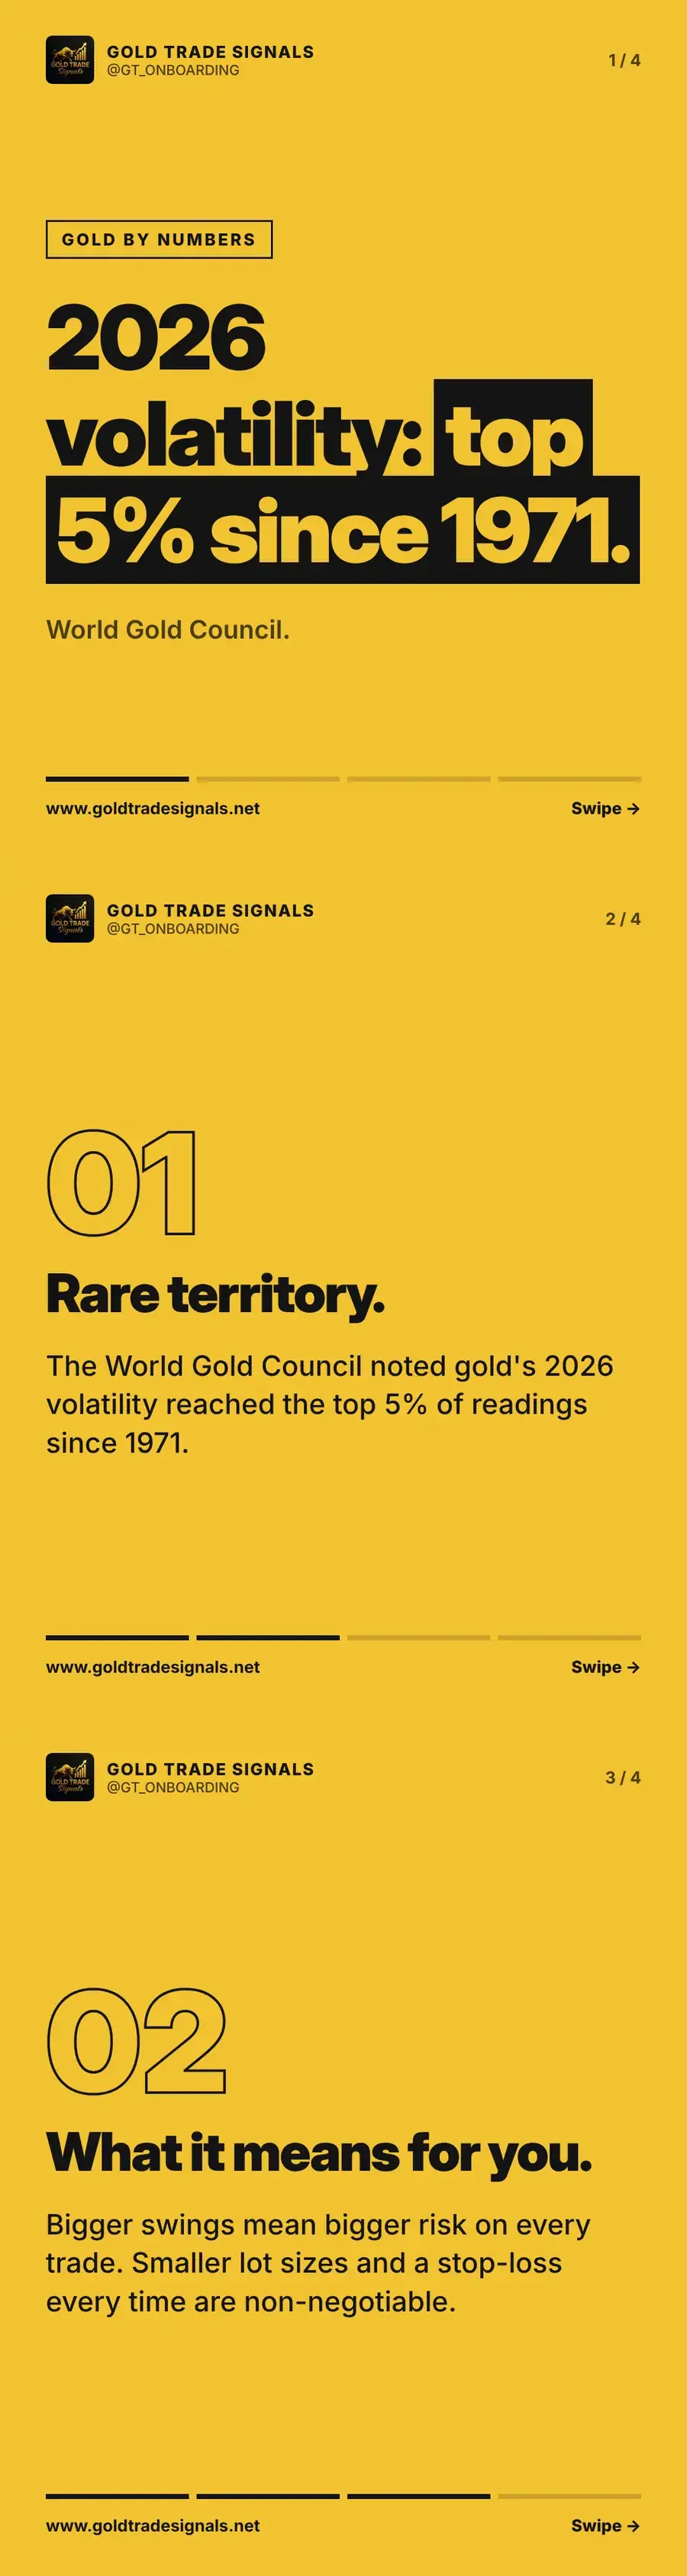
Gold volatility in 2026: top 5% of readings since 1971
The World Gold Council noted gold volatility in 2026 reached the top 5% of readings since 1971. What bigger swings mean for lot sizes and stop-losses.
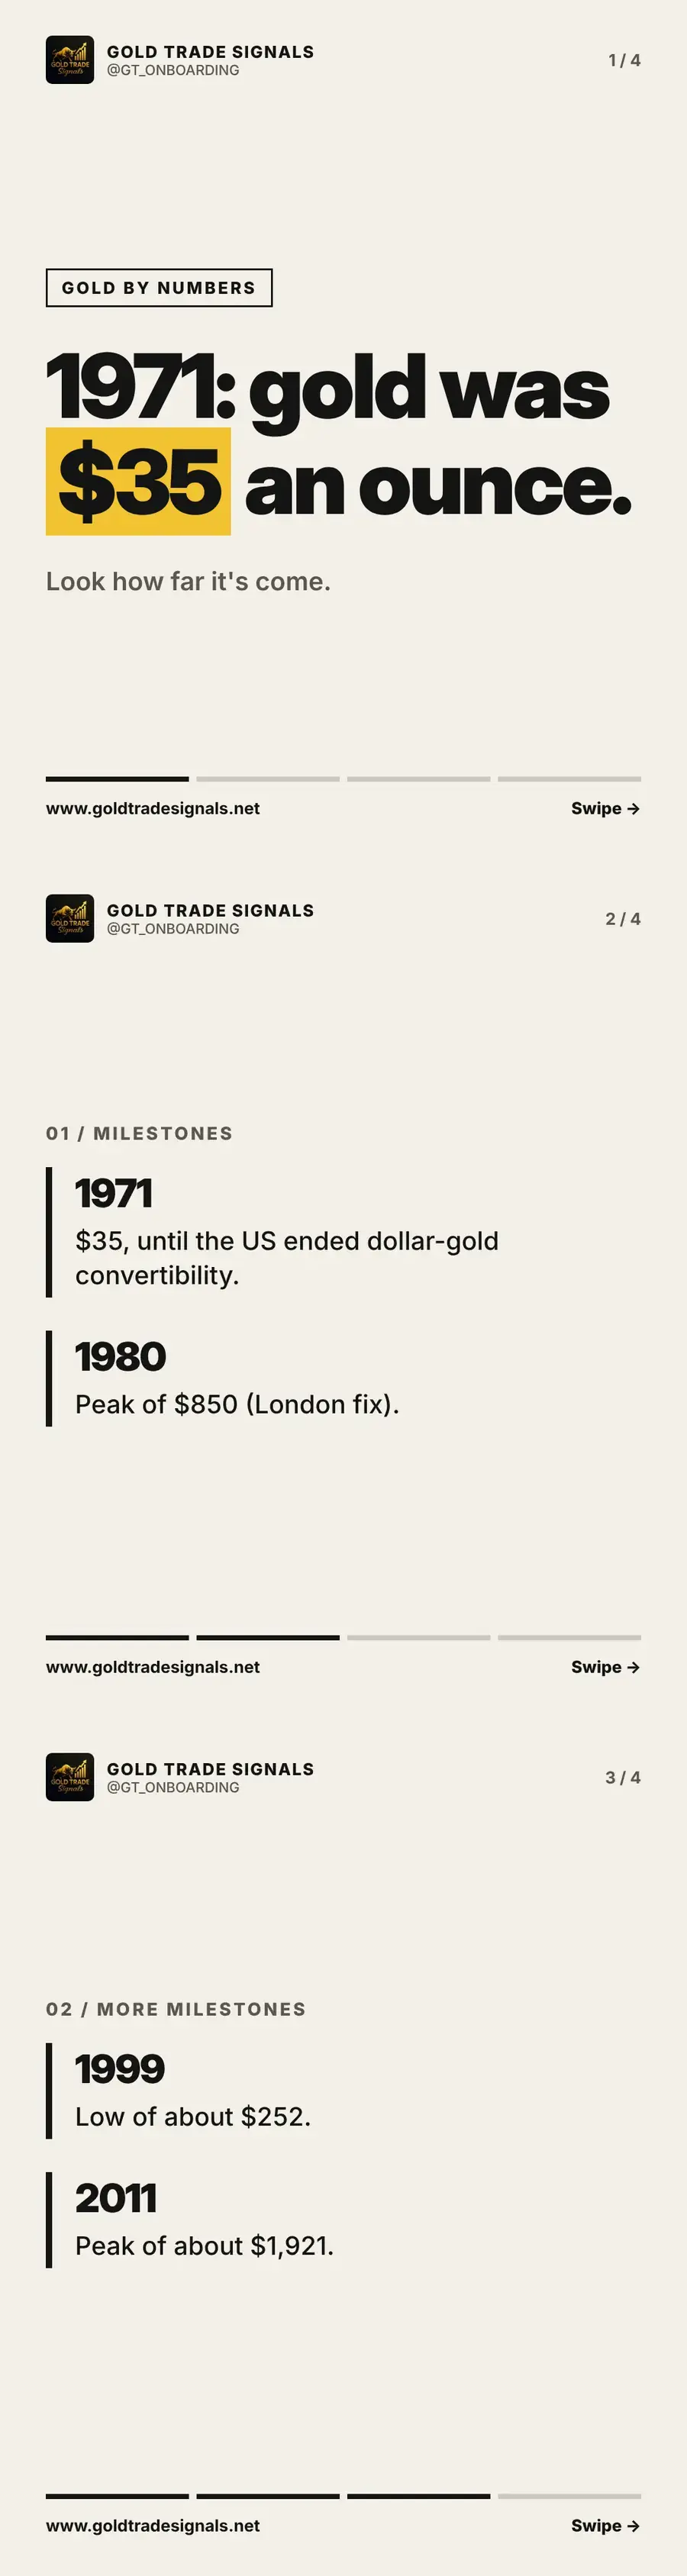
Gold price history: from $35 an ounce in 1971 to today
In 1971 gold was officially $35 an ounce. Follow the milestones since: the 1980 peak of $850, the 1999 low near $252 and the 2011 peak of about $1,921.