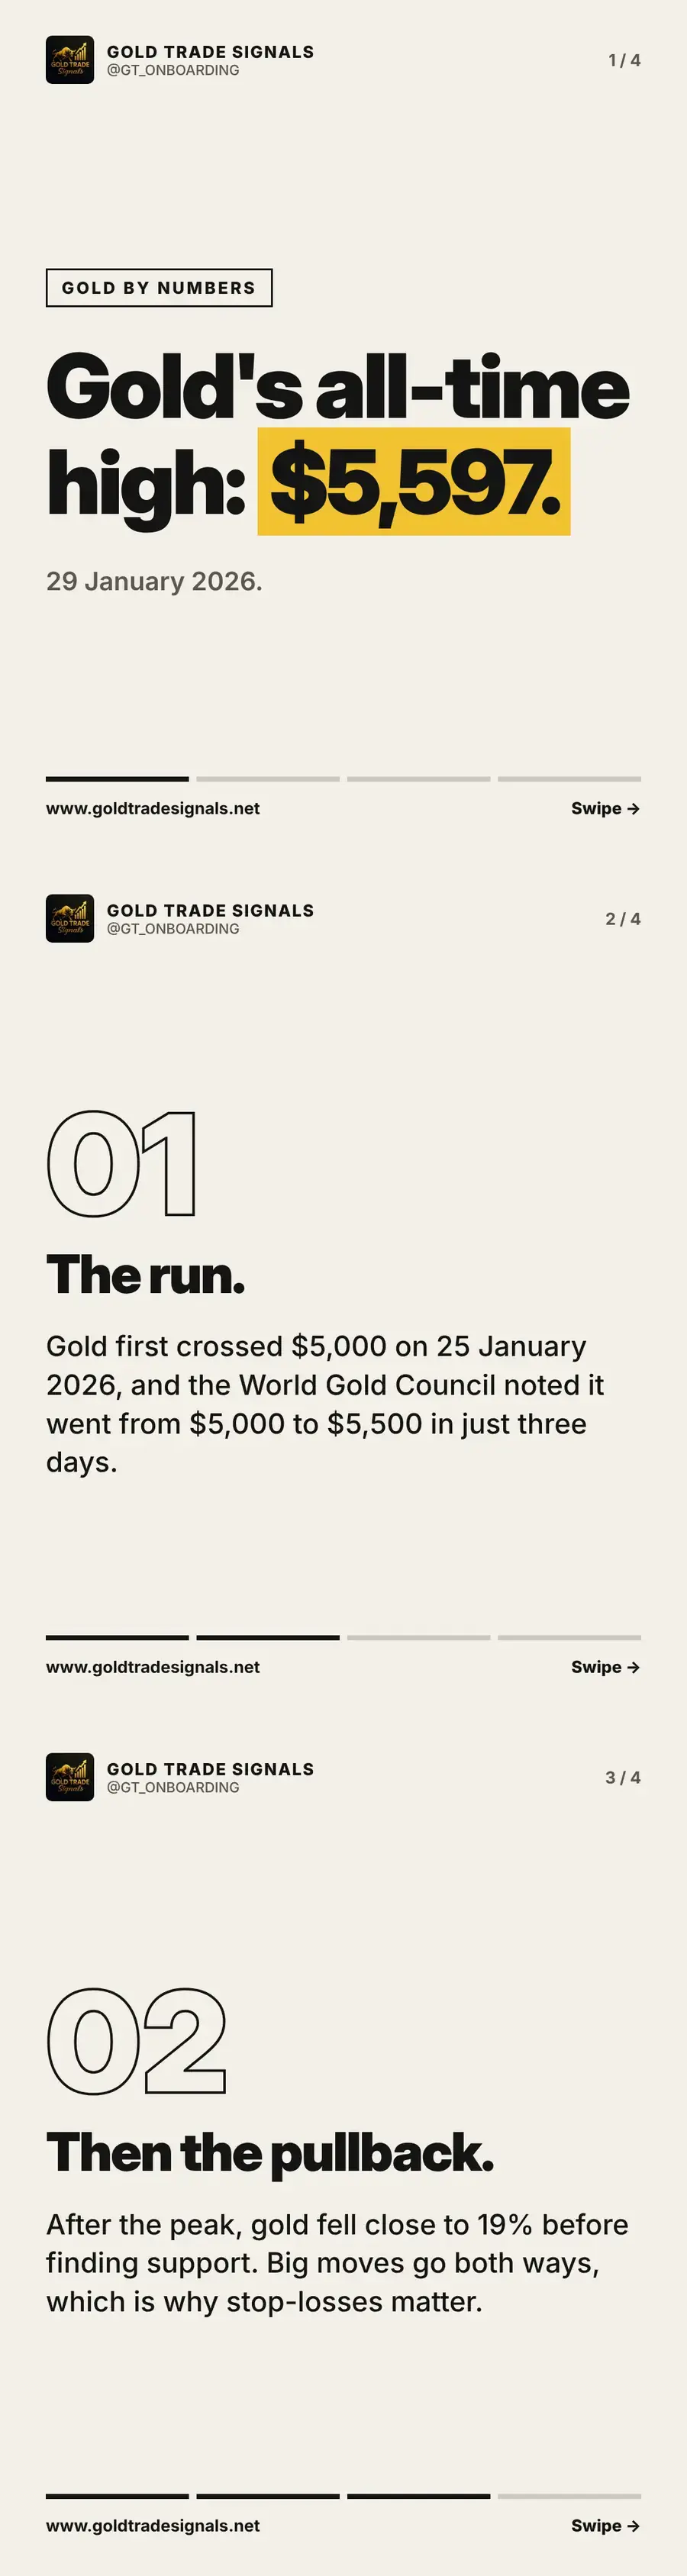
Gold's all-time high was about $5,597 an ounce on 29 January 2026, the peak of a remarkable run and the start of a sharp pullback. In this article we look at how fast the final leg happened, how far gold fell afterwards, and what both halves of the move teach anyone trading XAU/USD.
The run
Gold first crossed $5,000 an ounce on 25 January 2026. The World Gold Council noted that it then went from $5,000 to $5,500 in just three days, an extraordinary pace for a market that had taken years to cover earlier milestones. Four days after crossing $5,000, on 29 January, gold printed its all-time high of about $5,597.
Then the pullback
After the peak, gold fell close to 19% before finding support. A move of that size in the opposite direction, shortly after a record high, is a reminder that big moves go both ways. Anyone who bought near the top without a stop-loss would have watched a large part of their account disappear while hoping the rally would resume.
The lesson for gold traders
The run and the pullback are the same lesson. Gold can move further and faster than most people expect, in both directions, and the only protection that works in real time is a stop-loss decided before you enter. Every trade idea we send carries one, along with a take-profit, so the plan is complete before price starts moving. Trade gold with a plan, especially when the headlines are loudest.
Key takeaways
- Gold's record: about $5,597 an ounce on 29 January 2026
- $5,000 to $5,500 took three days, then a pullback of close to 19%
- Big moves go both ways, which is why stop-losses matter
Common questions
What is gold's all-time high price?
About $5,597 an ounce, reached on 29 January 2026, according to figures from the World Gold Council and other named sources.
When did gold first pass $5,000?
Gold first crossed $5,000 an ounce on 25 January 2026, then reached $5,500 within three days.
Trade ideas with the levels already worked out
Join the free community and receive XAU/USD trade ideas with entry, stop-loss and take-profit, live training on Tuesdays and Thursdays, and support whenever you are stuck.
Join free on TelegramOpen the calculatorsRisk warning: This article is educational content, not personal investment advice. Gold is a leveraged, volatile instrument and you can lose some or all of your capital. Gold Trade Signals is not FCA regulated. Read the full risk warning.
More from Gold by Numbers
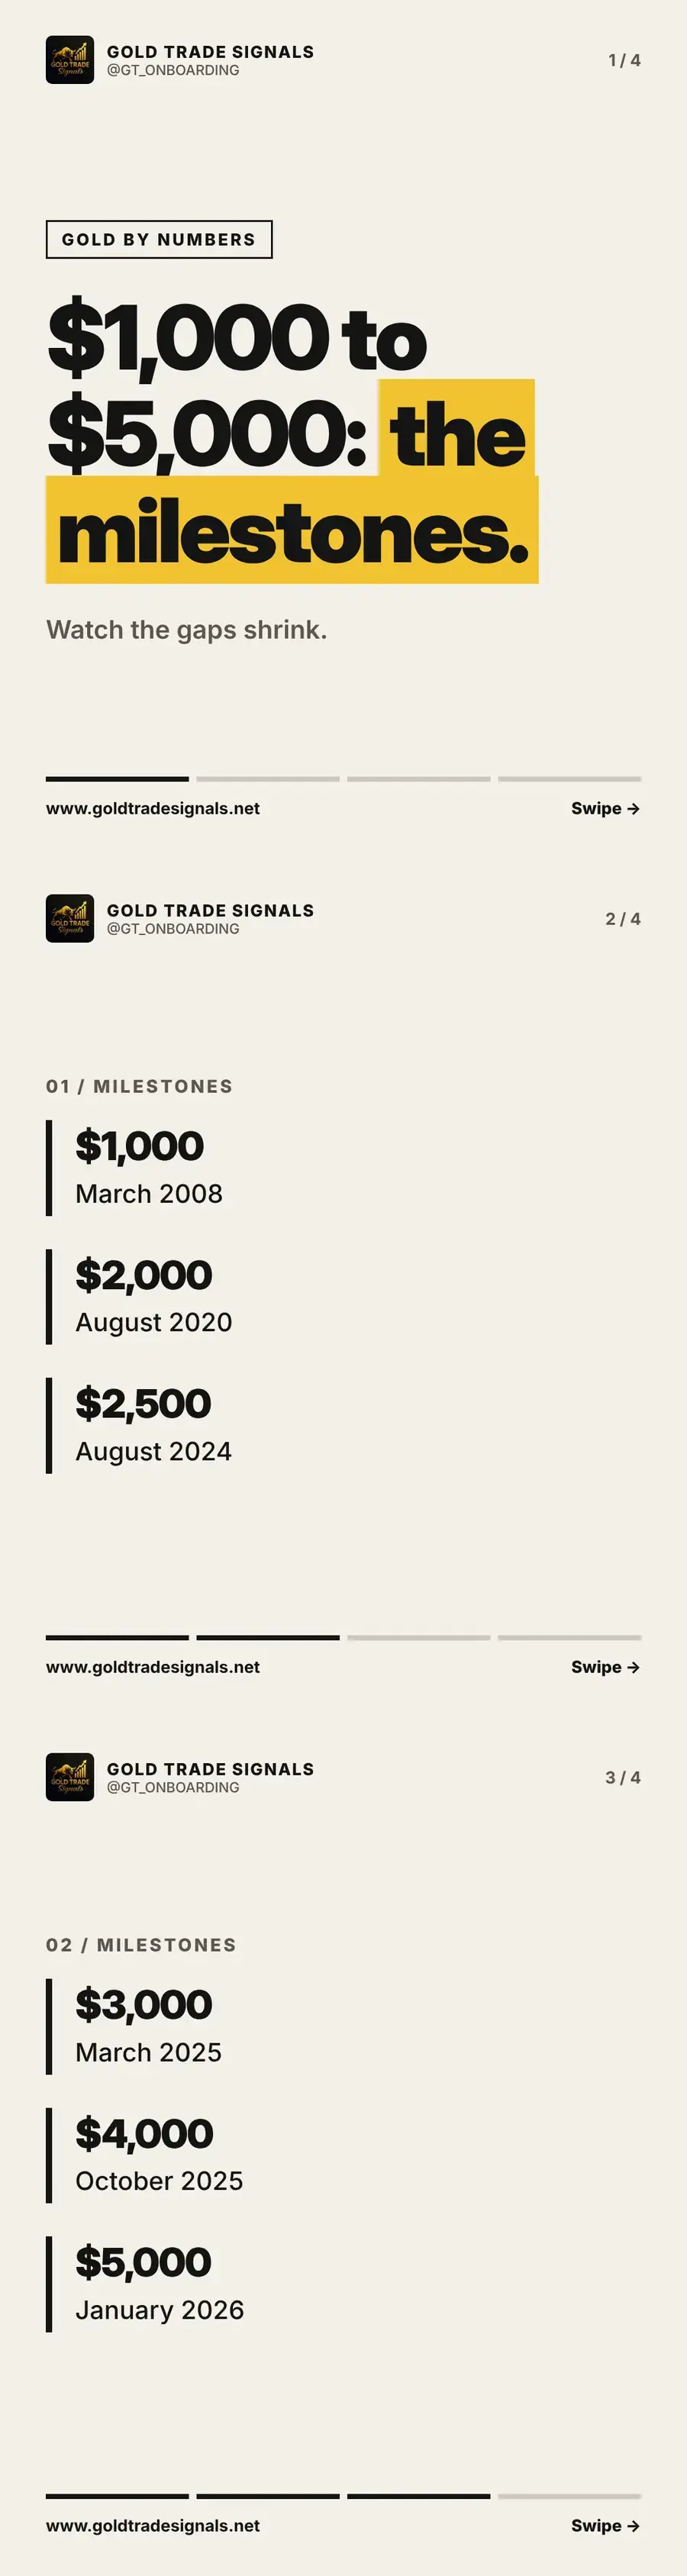
Gold price milestones: when gold crossed $1,000 to $5,000
From $1,000 in March 2008 to $5,000 in January 2026: the dates gold crossed each round-number milestone, and why the gaps between them kept shrinking.
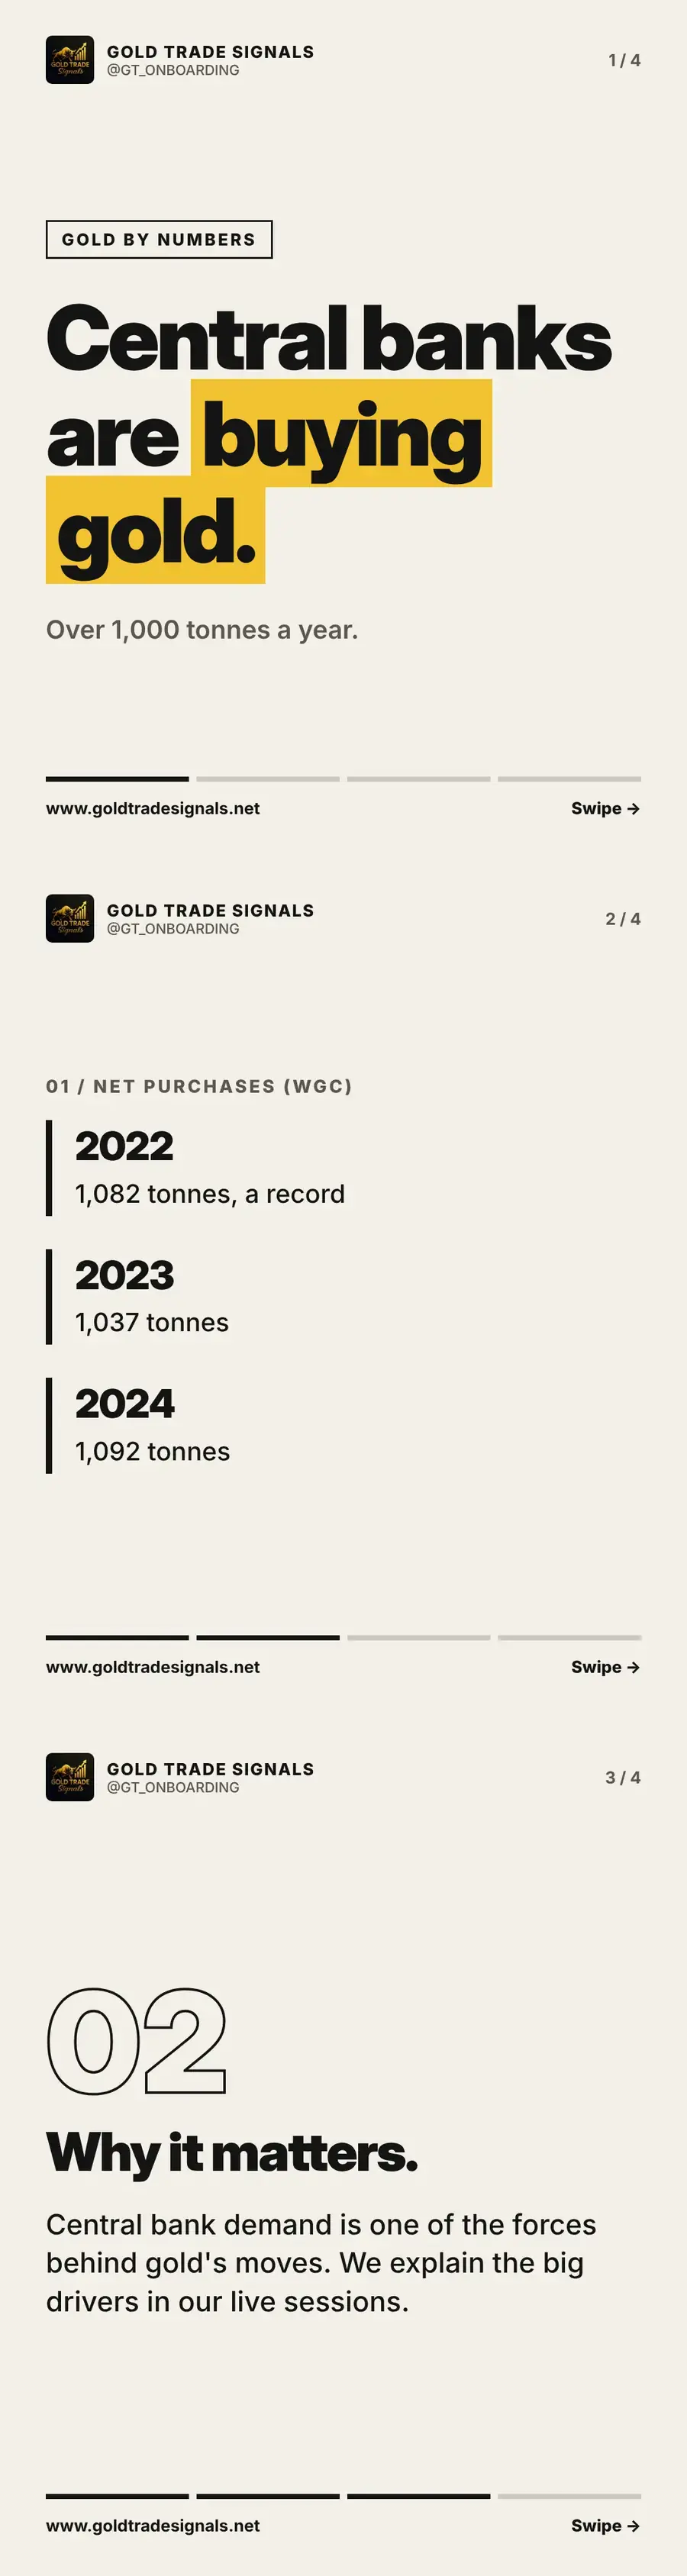
Central banks are buying gold: over 1,000 tonnes a year
Central banks bought over 1,000 tonnes of gold a year in 2022, 2023 and 2024, says the World Gold Council. We explain the figures and why they matter.
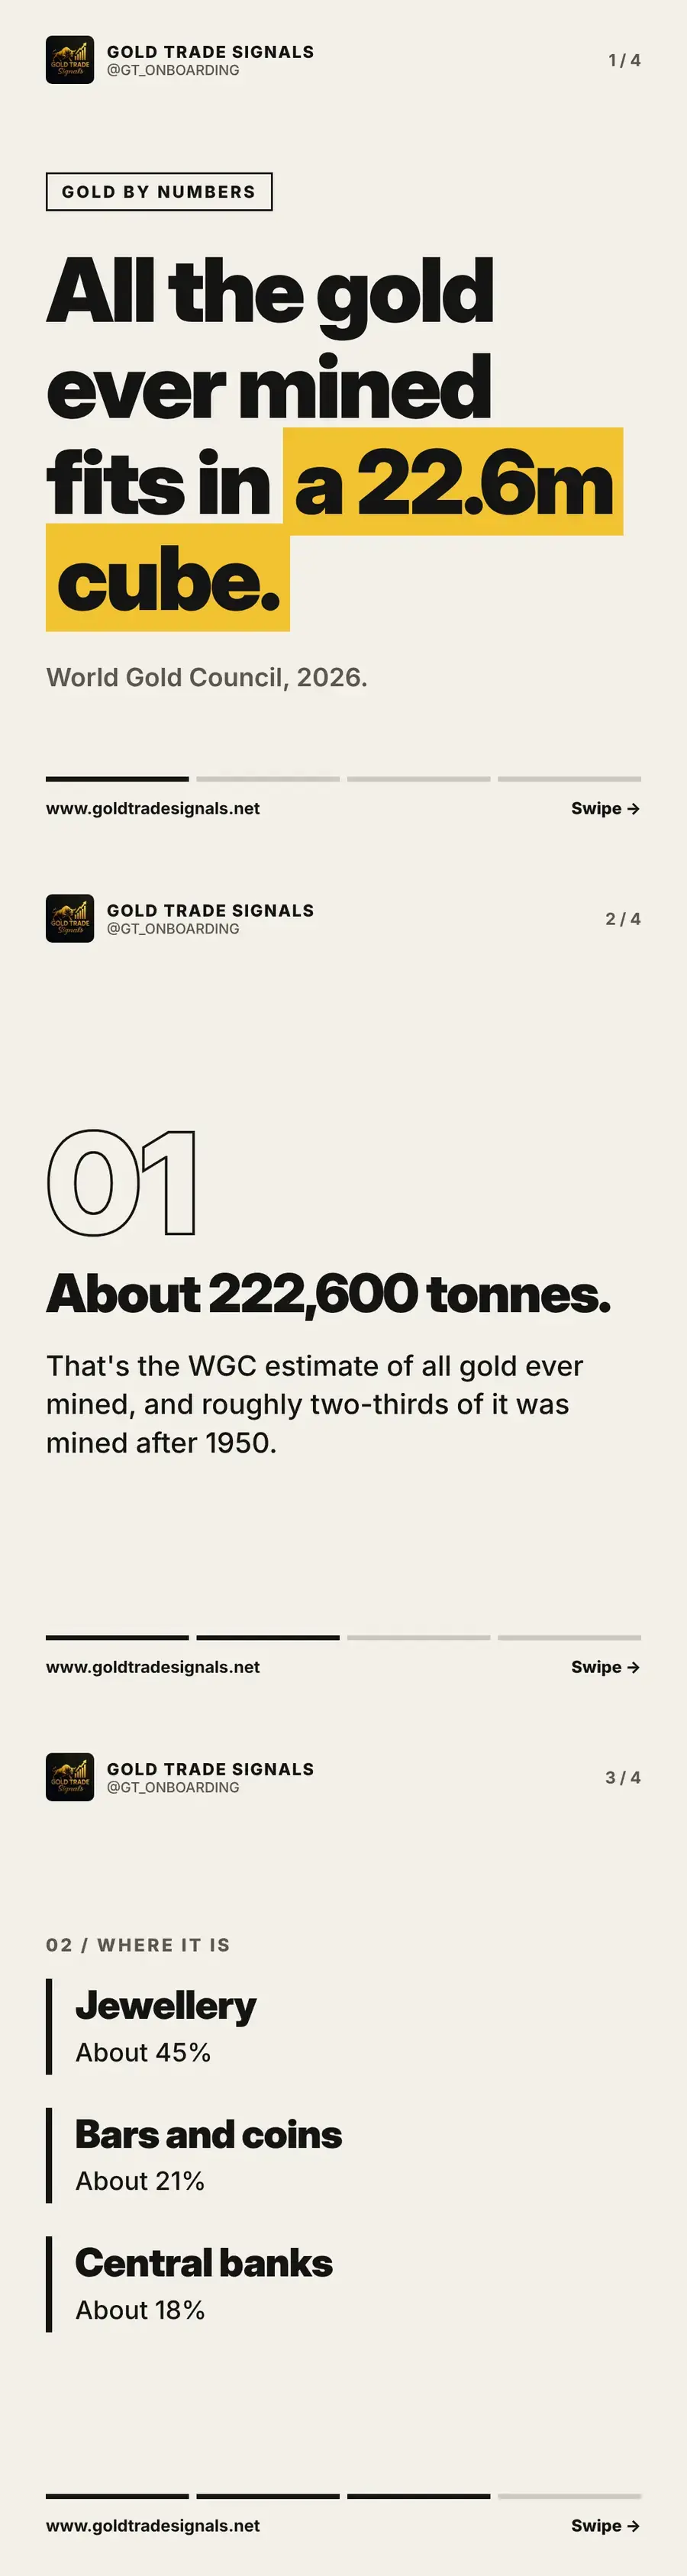
How much gold has ever been mined? About 222,600 tonnes
All the gold ever mined is about 222,600 tonnes, a cube about 22.6 metres wide. We break down where it is: jewellery, bars and coins, and central banks.