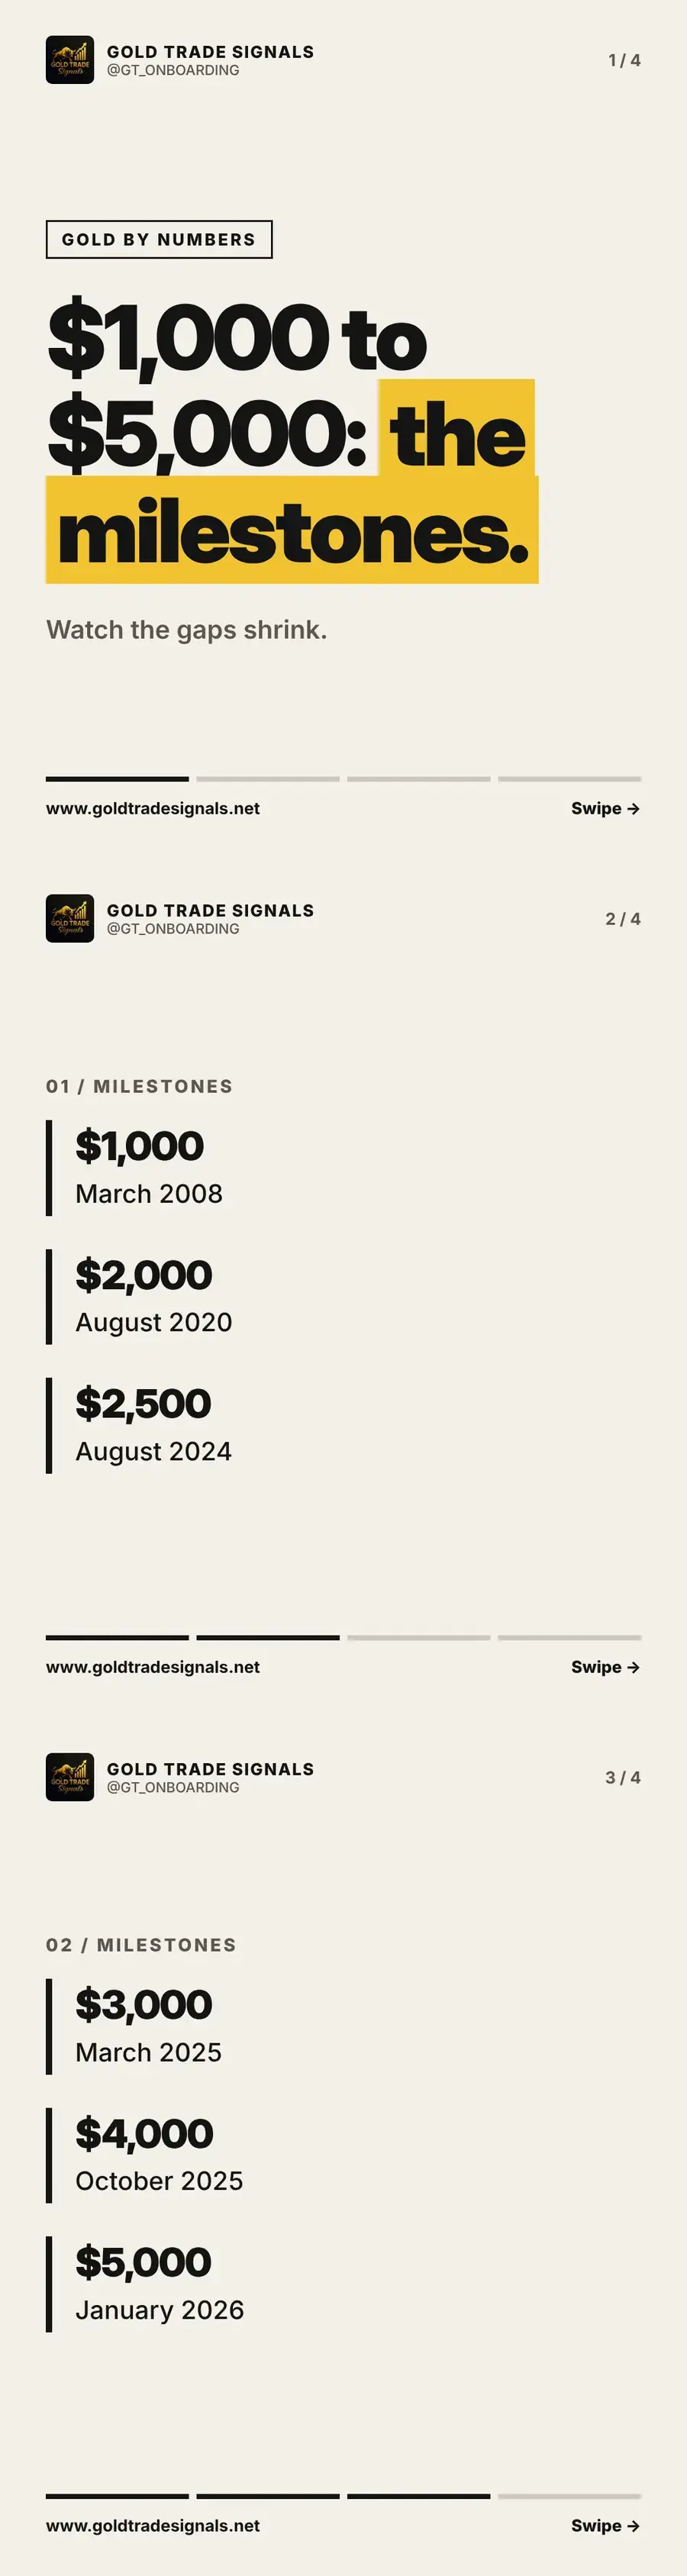
From $1,000 to $5,000 an ounce, gold has crossed a series of round-number milestones, and the gaps between them have grown shorter and shorter. In this article we lay out the dates for each milestone, look at how the pace changed, and consider what an accelerating market means for anyone trading XAU/USD.
The early milestones
Gold first crossed $1,000 an ounce in March 2008. It took more than twelve years to double, reaching $2,000 in August 2020. The next half-step, to $2,500, arrived in August 2024, four years later. For most of this period gold was a slow-moving market by the standards of what came next, with long stretches of sideways trading between each new round number.
Watch the gaps shrink
Then the pace changed. Gold reached $3,000 in March 2025, just seven months after $2,500. It crossed $4,000 in October 2025, another seven months on. And it crossed $5,000 in January 2026, only three months later. Each thousand-dollar step took less time than the one before, which is what makes this run stand out against the whole history of the market.
What this means for traders
An accelerating market is exciting, but faster moves cut both ways: the daily ranges that carry gold through a milestone can carry it back just as quickly. For a trader, that means lot sizes need to respect the larger moves and every trade needs a stop-loss set at entry. If you want to understand the moves behind these milestones, we explain the drivers in our live training sessions.
Key takeaways
- $1,000 in March 2008; $2,000 took until August 2020
- $3,000 March 2025, $4,000 October 2025, $5,000 January 2026
- Faster moves mean lot size and stop-losses matter more
Common questions
When did gold first reach $2,000 an ounce?
August 2020, more than twelve years after it first crossed $1,000 in March 2008.
How quickly did gold go from $4,000 to $5,000?
About three months. Gold crossed $4,000 in October 2025 and $5,000 in January 2026.
Trade ideas with the levels already worked out
Join the free community and receive XAU/USD trade ideas with entry, stop-loss and take-profit, live training on Tuesdays and Thursdays, and support whenever you are stuck.
Join free on TelegramOpen the calculatorsRisk warning: This article is educational content, not personal investment advice. Gold is a leveraged, volatile instrument and you can lose some or all of your capital. Gold Trade Signals is not FCA regulated. Read the full risk warning.
More from Gold by Numbers
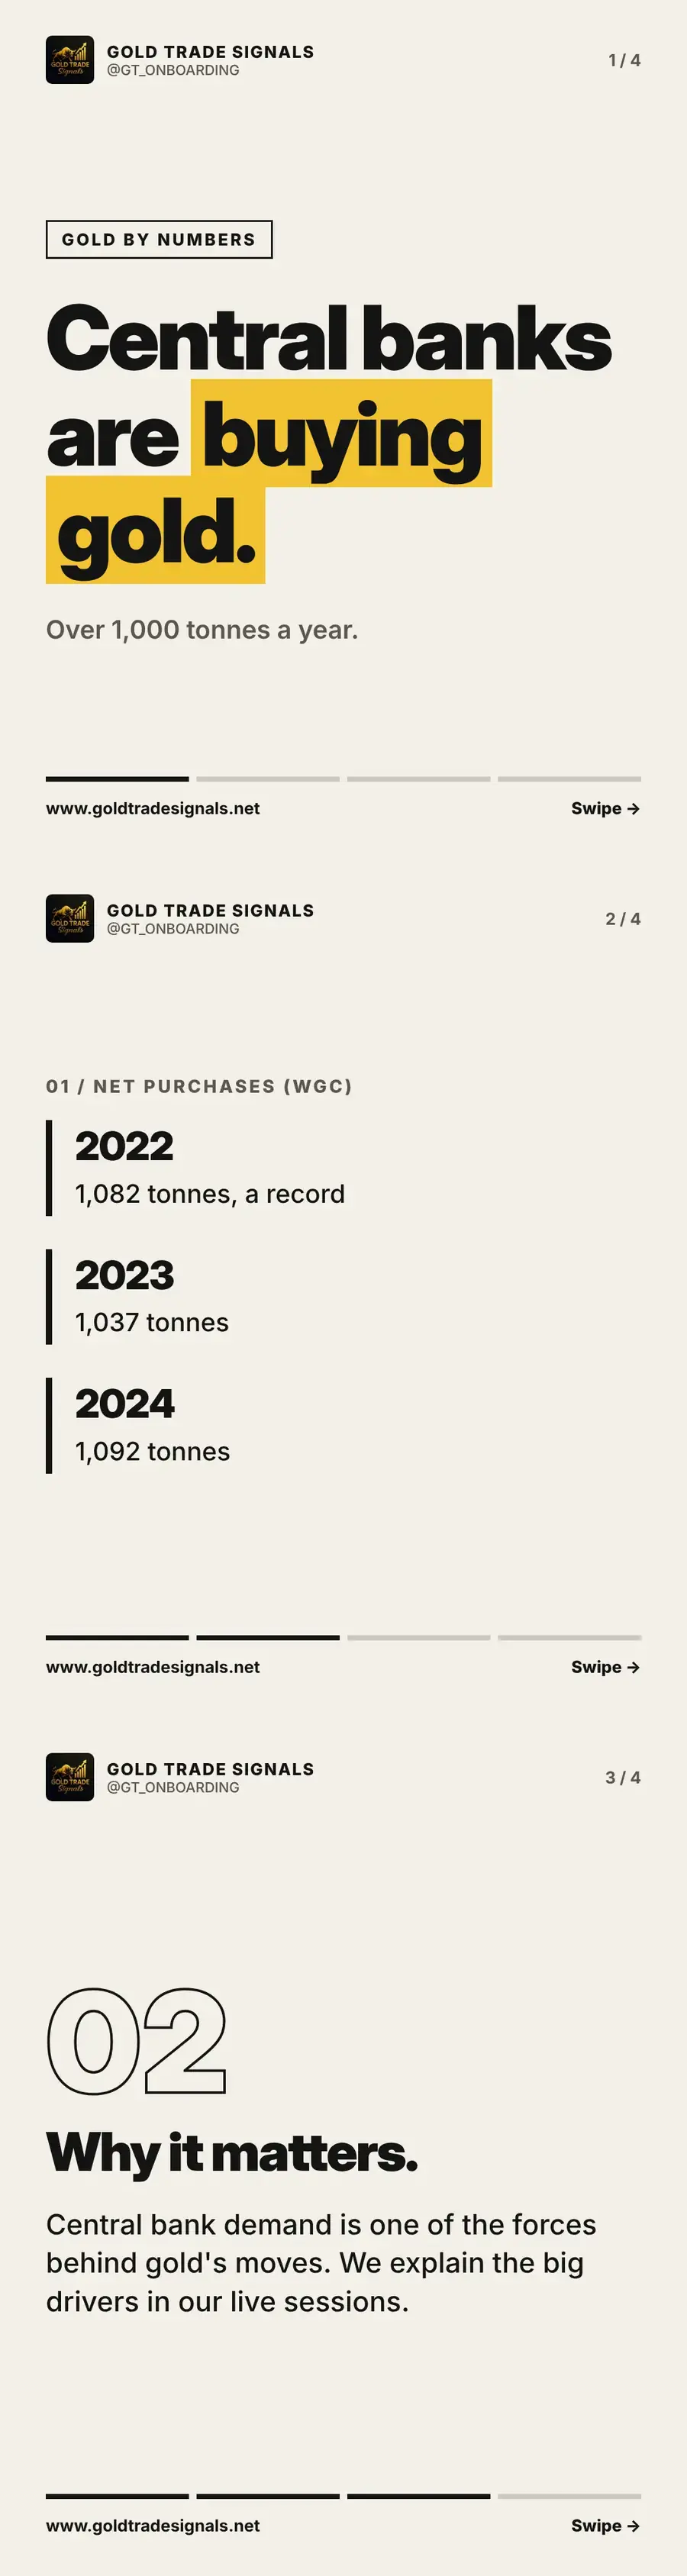
Central banks are buying gold: over 1,000 tonnes a year
Central banks bought over 1,000 tonnes of gold a year in 2022, 2023 and 2024, says the World Gold Council. We explain the figures and why they matter.
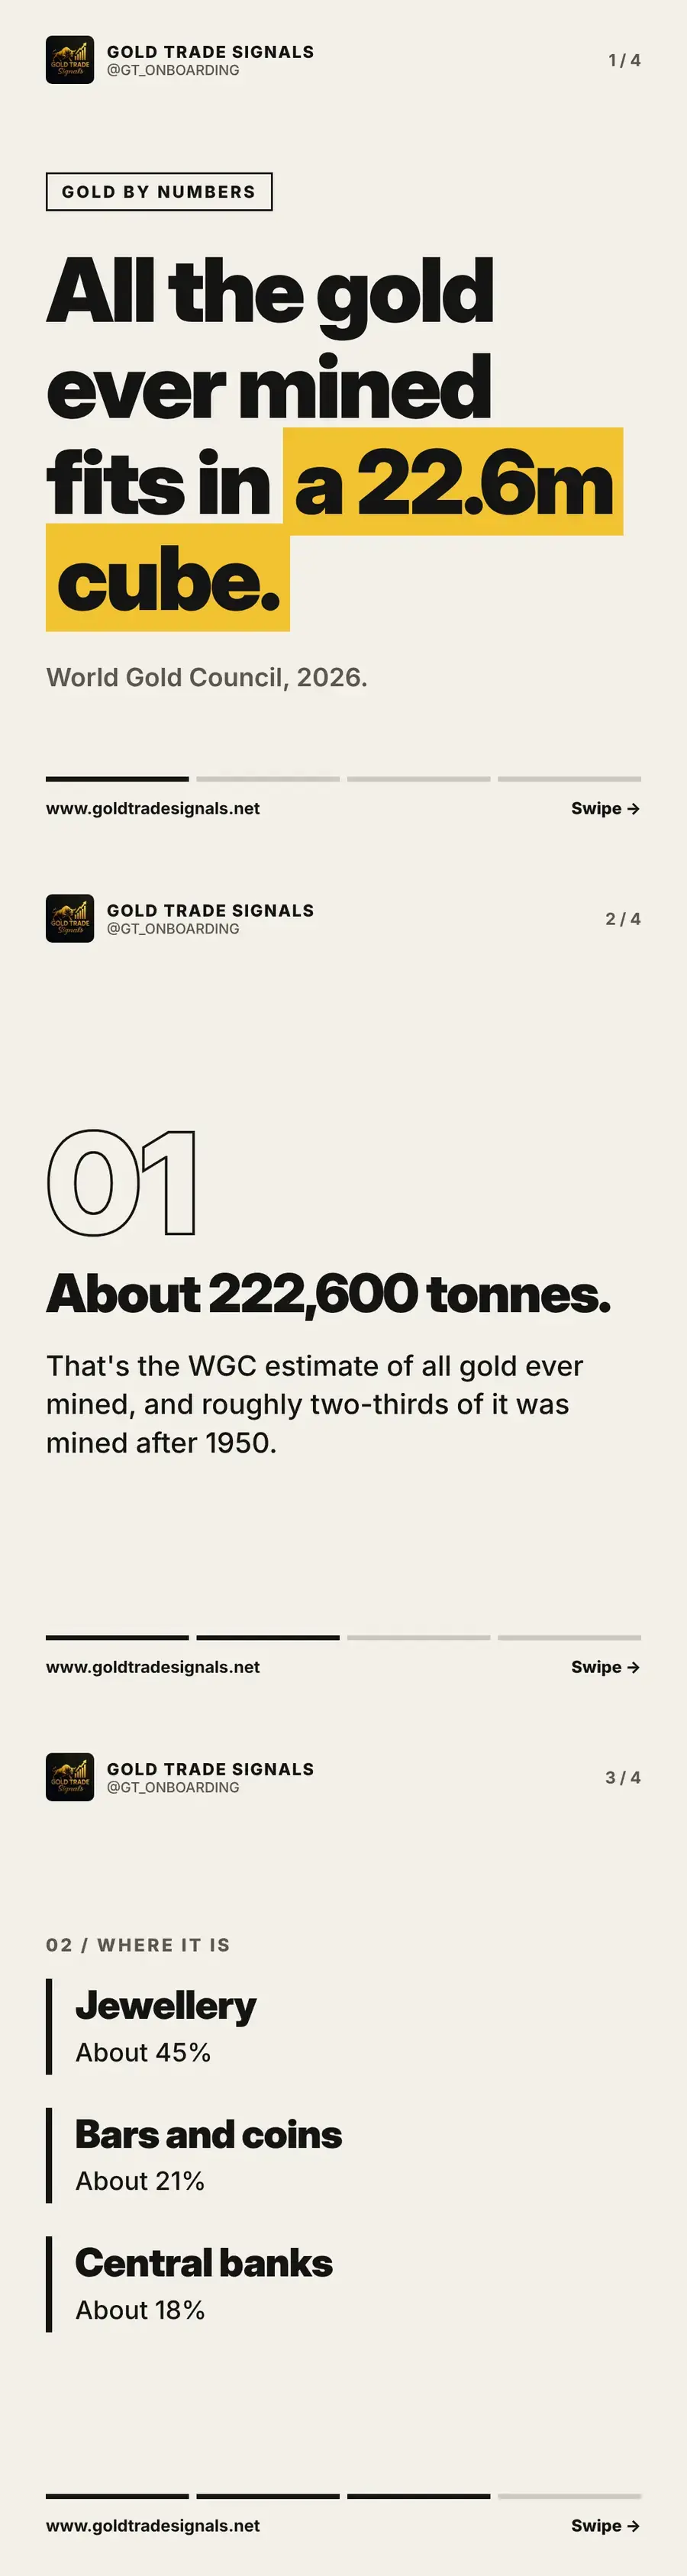
How much gold has ever been mined? About 222,600 tonnes
All the gold ever mined is about 222,600 tonnes, a cube about 22.6 metres wide. We break down where it is: jewellery, bars and coins, and central banks.
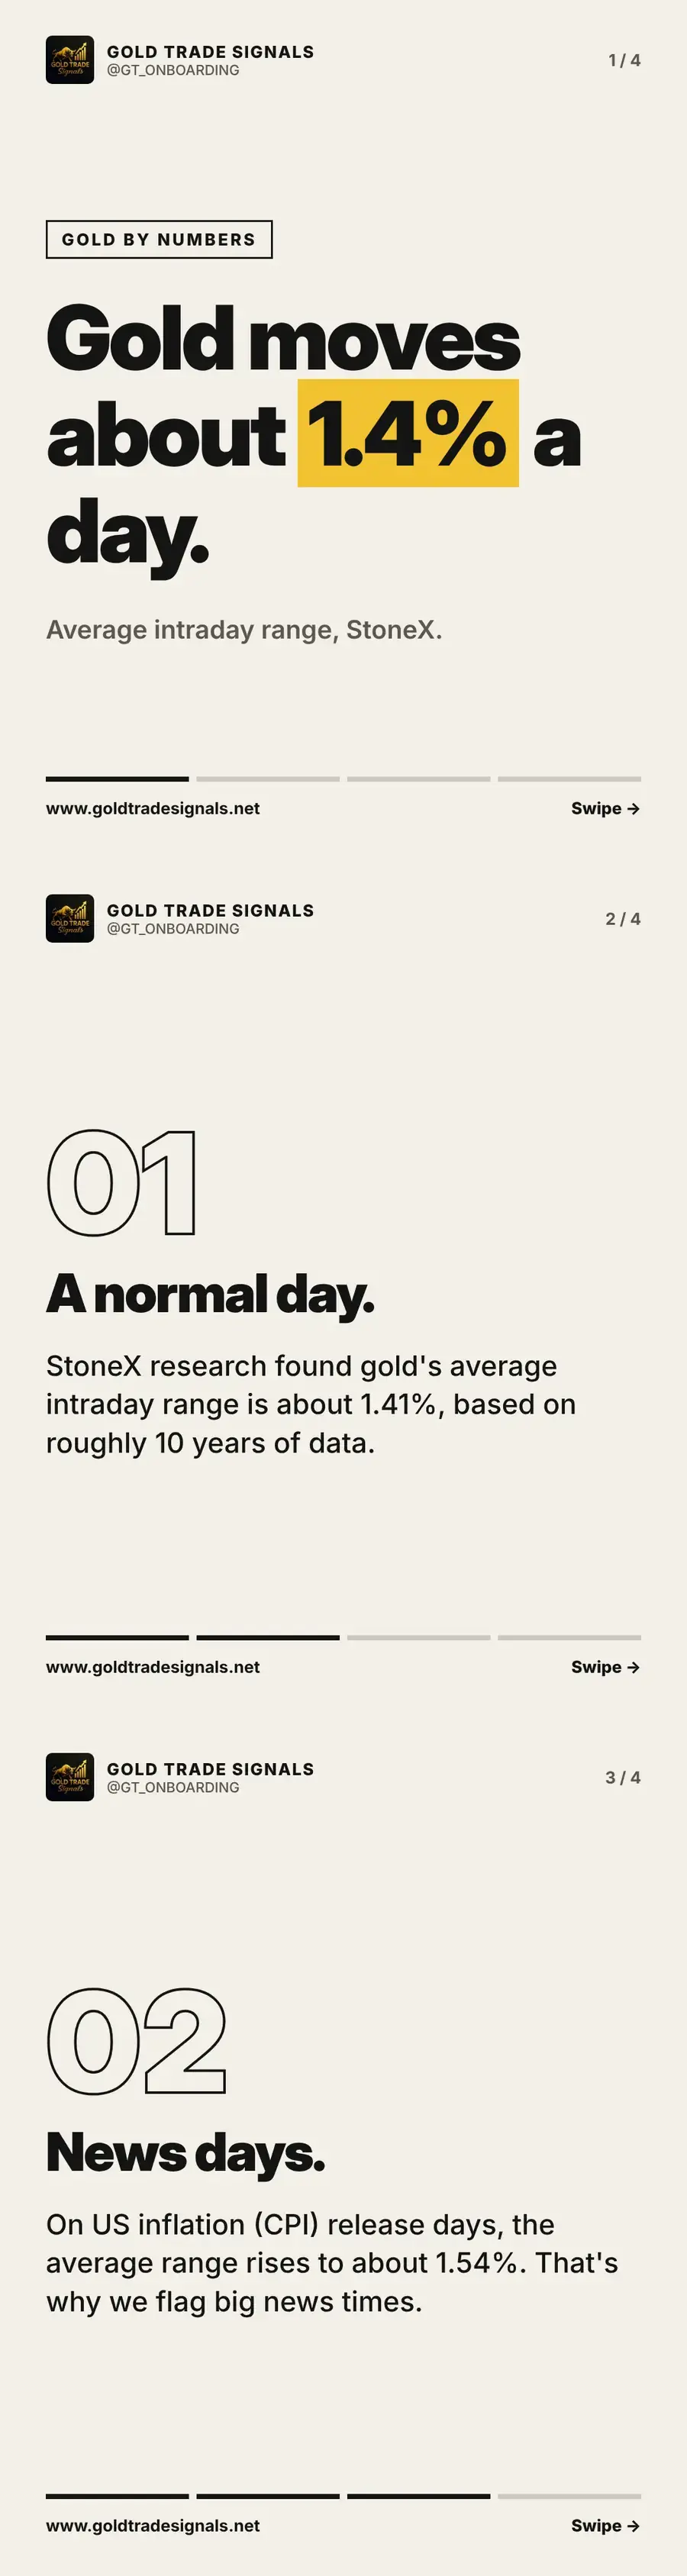
How much does gold move in a day? About 1.4% on average
StoneX research puts gold's average intraday range at about 1.41%, rising to about 1.54% on US inflation days. We explain what that means for your risk.