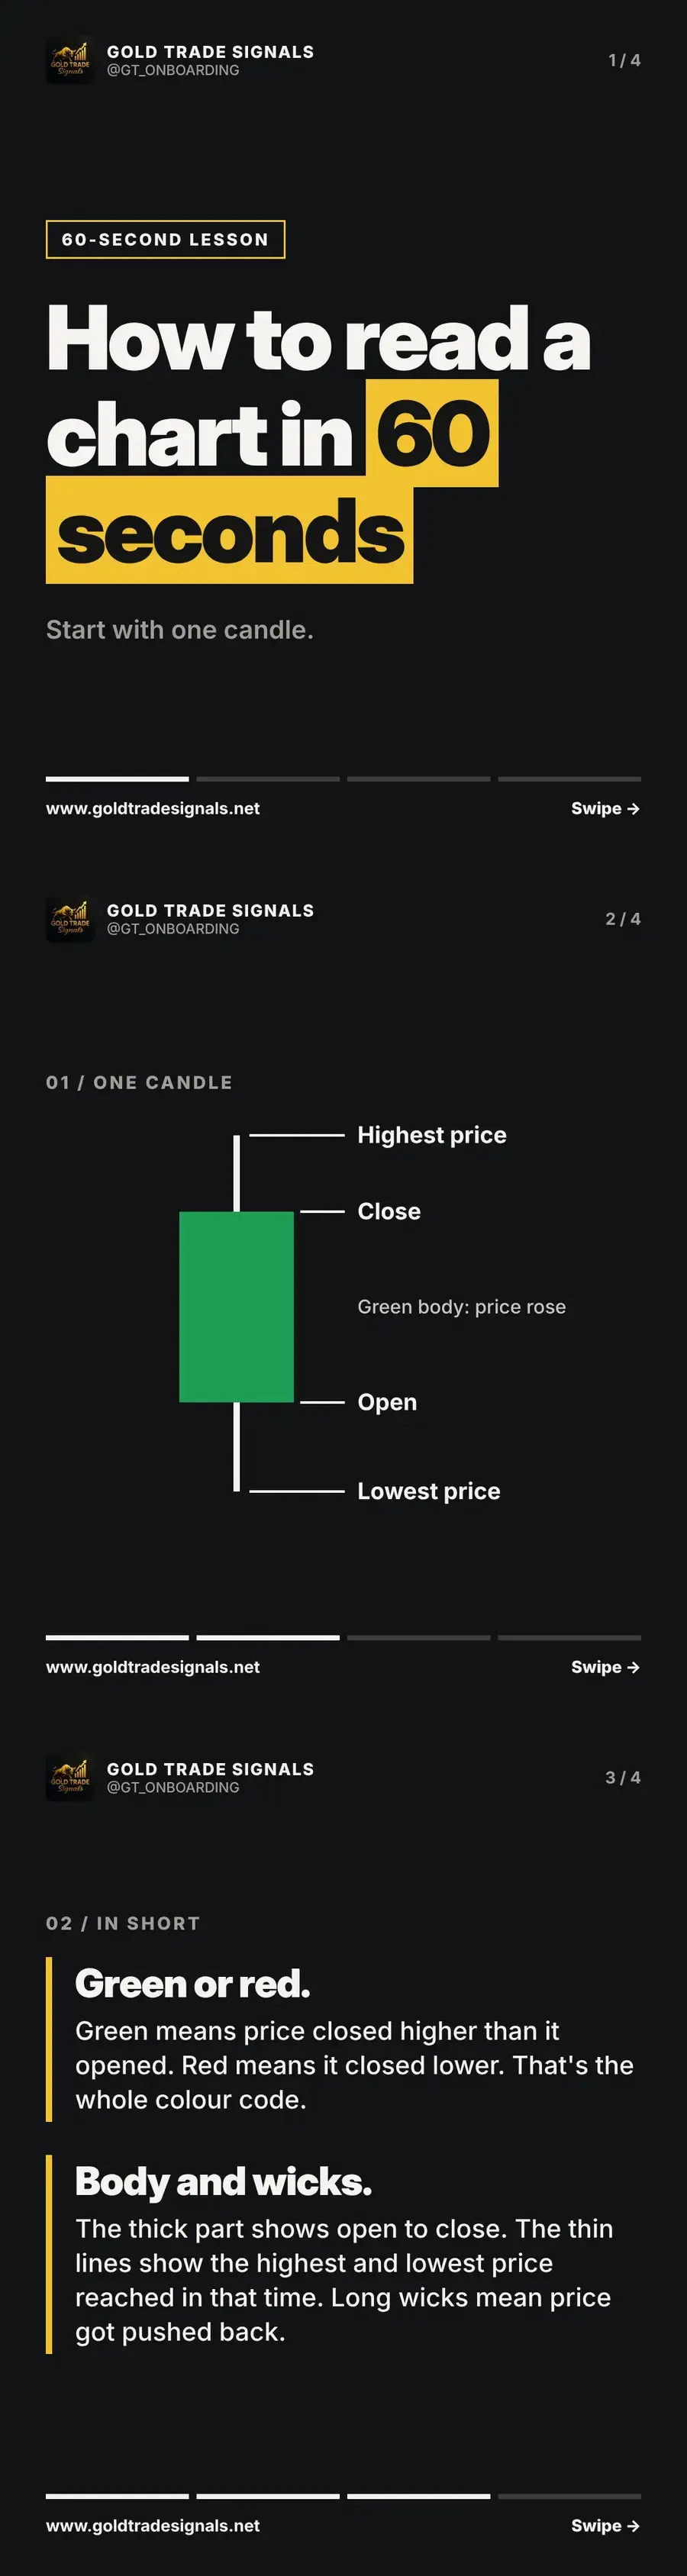
Charts look intimidating until someone explains a single candle to you. After that, every chart is just the same shape repeated. In this short lesson we break down one candlestick: what the colour means, what the thick body shows and what the thin wicks at each end are telling you about the gold price.
Green or red: the whole colour code
Each candle covers one block of time, such as one minute, one hour or one day, and tells you four things: where the price opened, where it closed, the highest point it reached and the lowest point it reached. The colour sums up the result. A green candle means the price closed higher than it opened during that period. A red candle means it closed lower. That is the entire colour code, and it is the same on every chart you will ever look at.
On a green candle the open sits at the bottom of the thick part and the close sits at the top. On a red candle it is the other way round. Once you can spot that, you can glance at a gold chart and immediately see whether buyers or sellers won each period.
Body and wicks
The thick part of the candle is called the body. It shows the distance between the open and the close. A long body means price travelled a long way in one direction. A short body means price ended up close to where it started, even if it moved around in between.
The thin lines above and below the body are the wicks. They show the highest and lowest prices reached in that period. Long wicks tell you that price pushed out to a level and then got pushed back before the candle closed. On gold, long wicks often appear around news releases. We read charts live with members twice a week, so you can practise this on real examples.
Key takeaways
- Green means price closed higher than it opened; red means lower.
- The body shows open to close; the wicks show the high and low.
- Long wicks mean price was pushed back before the candle closed.
Common questions
What does a green candle mean on a chart?
A green candle means the price closed higher than it opened during that period. Buyers were in control by the time the candle finished.
What do the wicks on a candlestick show?
The wicks show the highest and lowest prices reached in that period. Long wicks mean price moved to a level and then got pushed back before the close.
Trade ideas with the levels already worked out
Join the free community and receive XAU/USD trade ideas with entry, stop-loss and take-profit, live training on Tuesdays and Thursdays, and support whenever you are stuck.
Join free on TelegramOpen the calculatorsRisk warning: This article is educational content, not personal investment advice. Gold is a leveraged, volatile instrument and you can lose some or all of your capital. Gold Trade Signals is not FCA regulated. Read the full risk warning.
More from Trading Basics
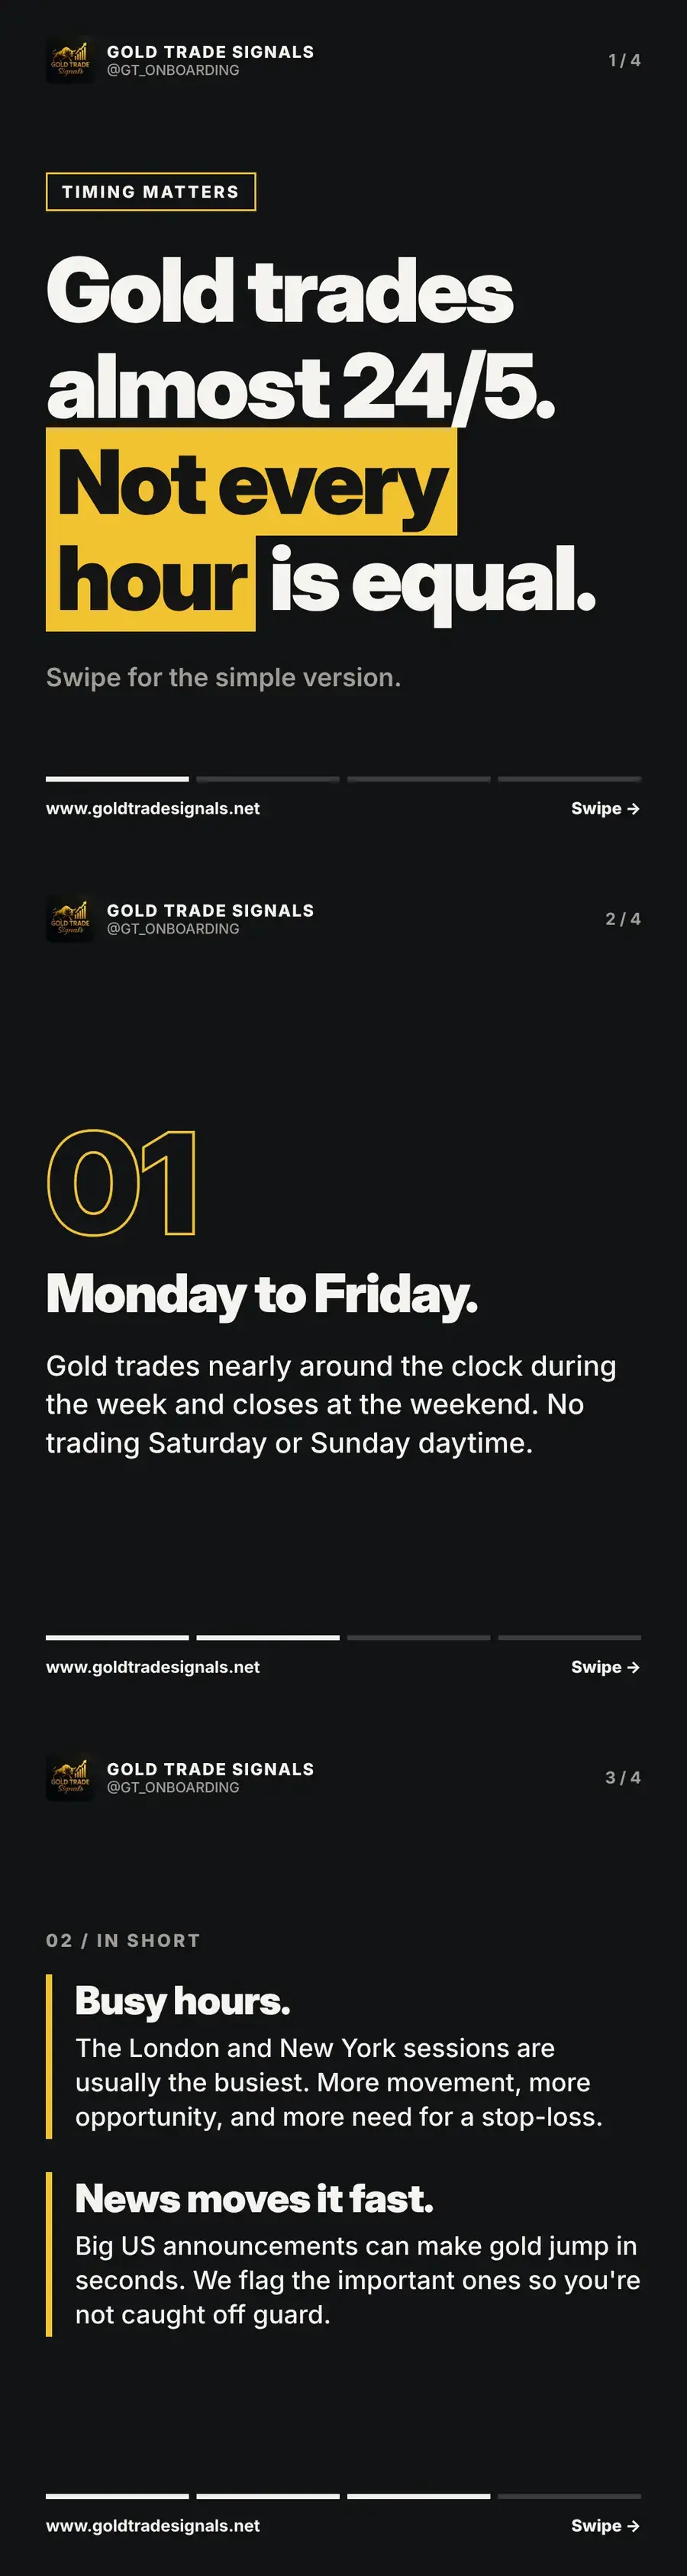
Gold trading hours: when the gold market is open
Gold trades almost around the clock Monday to Friday, but not every hour is the same. When it is open, which sessions are busiest and why news matters.
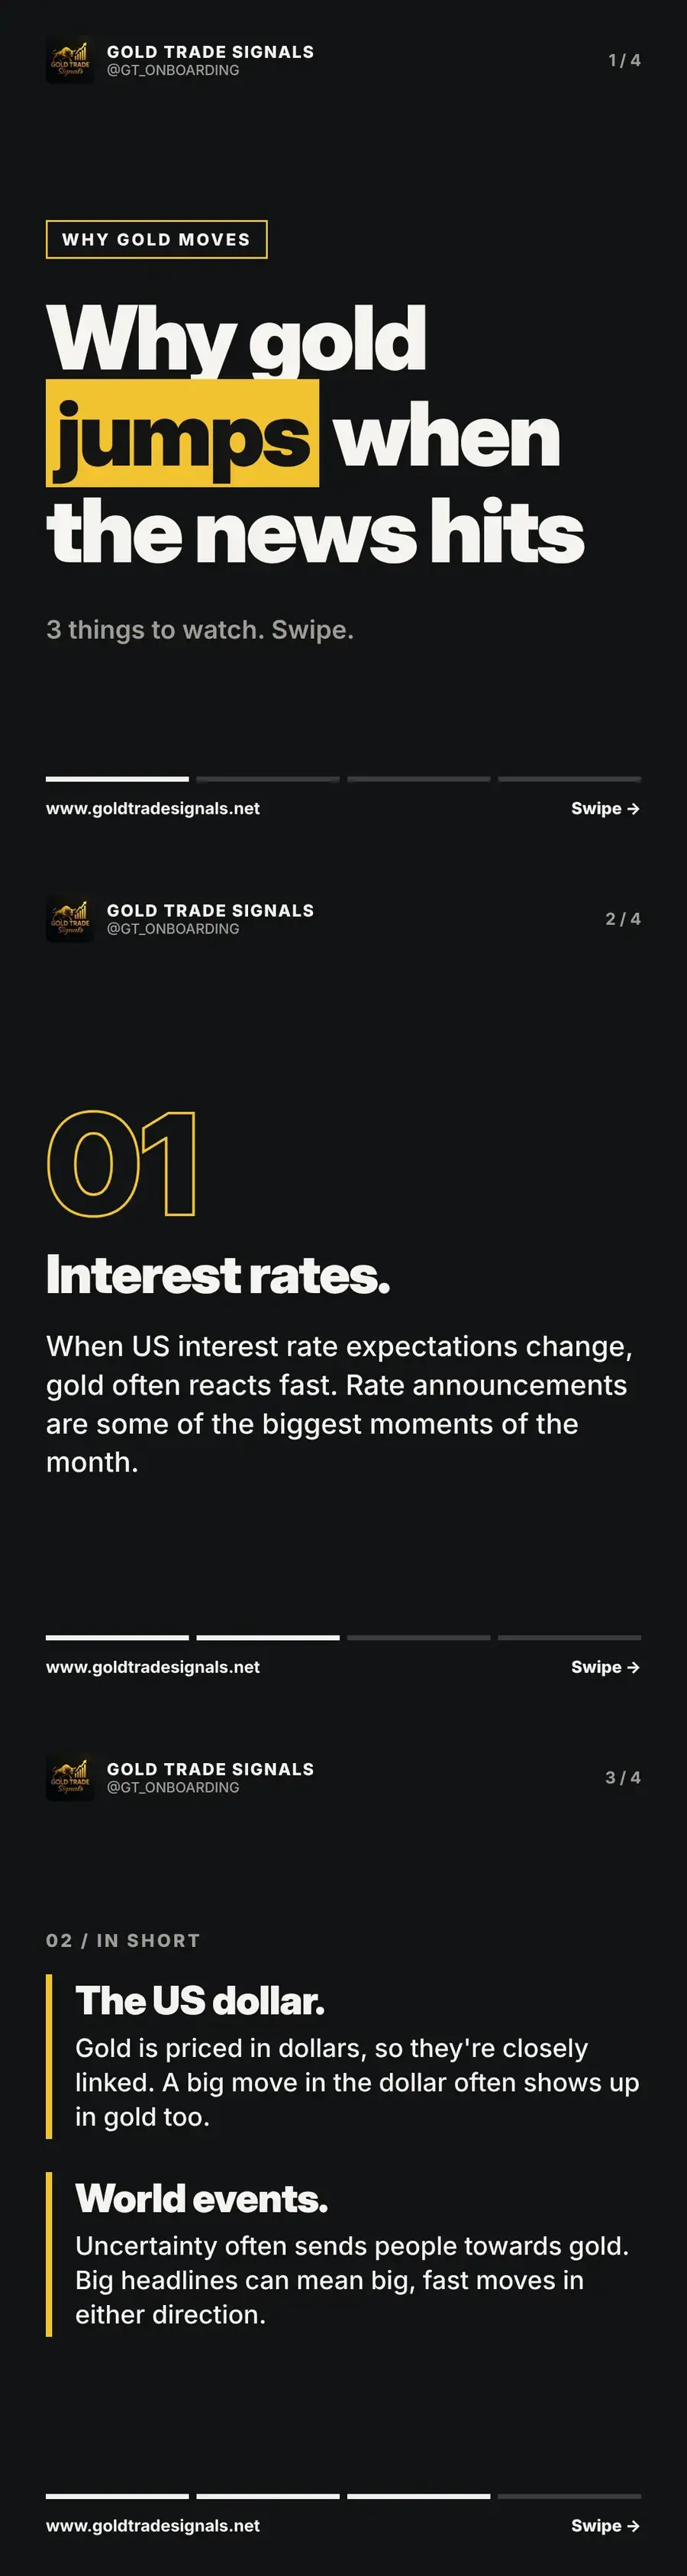
Why gold moves when the news hits: three things to watch
Ever seen gold jump in seconds and wondered why? Usually it is the news. We explain the three big drivers: US interest rates, the dollar and world events.
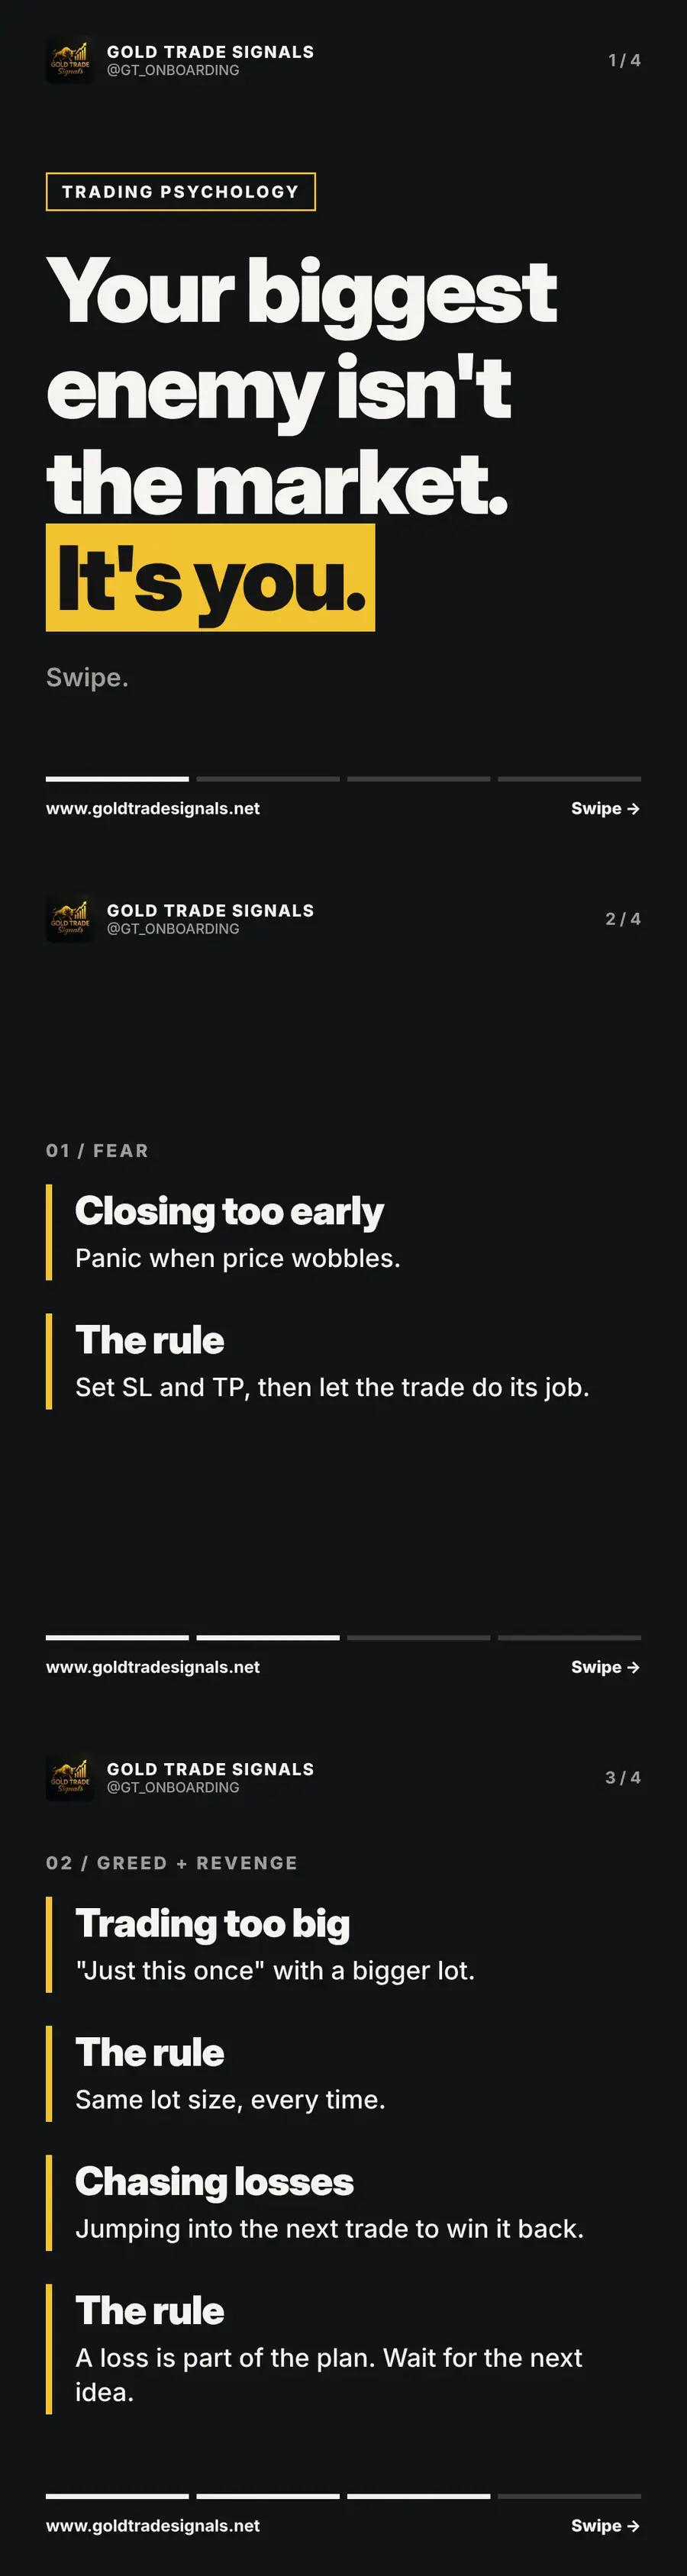
Trading psychology: fear, greed and revenge trading
Your biggest enemy in trading is not the market, it is your emotions. How fear, greed and revenge trading show up for gold traders, and the rule for each.